EXECUTIVE SUMMARY
WA public hospitals face challenges unique to WA as the most sparsely populated state in Australia. On measures of hospital efficiency WA public hospitals appear to perform slightly better than average, though they are a significant way behind the most efficient.
On measures of cost efficiency in large, medium and small acute hospitals, WA public hospitals are more expensive than average and this is reflected in the amount spent per person on public hospital services in WA being slightly more per person than the Australian average.
Labour costs per case mix adjusted separation in WA public hospitals were about 4 per cent above the Australian average in 2005-06. This may be due to labour market pressures in WA compared to the rest of Australia. It may also be the result of the workforce profile in WA public hospitals. The available data shows that WA public hospitals have proportionally fewer nurses and diagnostic professionals and a greater proportion of administrative and clerical roles than the Australian average.
Only 41 per cent of the WA public hospital workforce are nurses. This compares with an average of 44 per cent across Australia. WA also appears to have fewer diagnostic and other health professionals with only 12 per cent of the WA public hospital workforce in this role compared to 15 per cent on average across Australia and 20 per cent in Victorian public hospitals.
WA leads Australia in the use of private hospitals to treat public patients. The WA Government spends 15 per cent of its budget for hospital services on private hospitals and appears to get very good value for money.
The people of WA receive greater transparency in cost and quality performance at the level of individual hospitals as a result of WA Government policy.
This report outlines four reform initiatives that the WA Government could pursue to improve health outcomes for every Western Australian and lead Australia in health care reform. These are:
- Continue WA's leadership in the use of private hospitals for the treatment of public patients by examining the role for private hospital managers and facilities in new hospital construction, hospital expansion and treatment of public patients in private facilities.
- Increase transparency and accountability by making all performance information, down to an individual hospital level, available online. This should specifically include measures of quality and safety such as infection rates and unplanned readmission rates, as well as waiting times for elective surgery by speciality and by surgeon at individual hospitals. Some of this information is already available online for other public hospital systems in Australia.
- Empower patients and ensure higher standards of care by facilitating a system, possibly voluntary for patients, to create electronic patient records that can be accessed by all healthcare providers and patients in WA. This should aim to ensure that all relevant information is available to all healthcare providers that a patient might choose whenever it is required.
- Examine a model to pool government and private health funding to enhance health outcomes, minimise waiting times and improve cost effectiveness of the system. This might occur as part of the current negotiation of the Australian Health Care Agreement between the Australian and WA Governments. The intent of this model, which may also be voluntary for patients and only apply to some portion of the Western Australia's population as a trial, would be to eliminate inefficiencies between government health programs that currently exist, better inform patients of their options, provide for a greater emphasis on preventative health care, minimise or eliminate waiting times and deliver better health outcomes overall for patients.
Through leadership by the WA Government, which embraces innovative service delivery and infrastructure provision, transparency of information and patient-centred health, all Western Australians will benefit.
INTRODUCTION
The health system in Australia is characterised by disparate sources of funding provided to some extent by every level of government, a multitude of providers including hospitals, pharmacies, general practitioners and other speciality health practitioners, and widely varying availability of information for patients on the true costs of service, costs and benefits of care and the quality of the care provided. The health system in Western Australia incorporates this same range of highly complex interactions and transactions.
This report is intended to briefly review the publicly available data on the efficiency and quality of the public hospital system in WA. The report was constrained to publicly available data because of the resources and time available for its completion and in order to maintain complete independence. The report has also not involved formal consultation with government, health providers or the WA Health Department, which a more comprehensive and exhaustive study would necessarily include.
The report's focus on public hospitals in WA has been chosen for two primary reasons. Firstly, information of reasonable quality and scope is publicly available on the efficiency and quality of public hospitals in WA. Data for the report was predominantly sourced from Australian Institute of Health and Welfare publications and the Report on Government Services 2008, published by the Productivity Commission. This data, combined with WA Health publications, provides a basis for the comparison of WA public hospitals with those in other states and territories according to a range of measures including effectiveness and efficiency. The most up to date data set available at the time of writing that provides for comparisons between states is typically from 2005-06.
Secondly, the WA public hospital system has been chosen on the basis that responsibility for it falls entirely within the policy control of the WA Government (subject to funding conditions imposed through the Australian Health Care Agreement).
Compiling a report constrained to publicly available data has obvious limitations. However, this constraint plausibly provides insight into the extent to which the WA public hospital system is transparent and accountable in terms of its performance and quality. The scope of findings from this report are analogous to the conclusions that an average WA patient can draw about health services they might choose to access based on publicly available data. This constraint does impose limits on the extent of possible conclusions.
This report deliberately focuses on issues concerning the efficiency and transparency of reporting in relation to WA public hospitals. It does not deal directly with other significant issues which could easily constitute the basis for a single investigation. Important issues in WA health policy not canvassed in this report include, but are not limited to, indigenous health, rural and remote health service delivery, emergency department access and elective surgery waiting times. That this report does not consider these and other important issues in detail does not reflect upon their relative importance to WA.
PART ONE
WA PUBLIC HOSPITALS -- AN AVERAGE HOSPITAL SYSTEM?
Health expenditure by the WA Government, particularly on hospital services, consumes a substantial portion of the state budget and in recent years has been growing rapidly. According to Australian Institute of Health and Welfare (AIHW) data, total recurrent health expenditure in WA from all sources of funds grew at an annual rate of 7.7 per cent between 2003-04 and 2005-06. (1)
Expenditure by the WA Government on health care services is budgeted to be in excess of $4.5 billion in 2008-09, representing a 5.8 per cent increase on 2007-08. Of this expenditure, admitted patient services, which represent WA hospital costs, are budgeted at more than $2.5 billion. (2) On these figures, total health care expenditure represents almost 25 per cent of the WA Government's total budgeted expenses of $18 billion. Hospital services consume in excess of 50 per cent of WA Government expenditure on health. (3) The hospital services funded by the WA Government therefore represent one of the largest expense items facing the WA Government and Western Australians in general.
As an illustration of the growing significance of expenditure on public hospitals in WA, total expenditure (from all sources) on public hospitals in WA increased by almost 20 per cent, from $1,865 million in 2003-04, to $2,244 million in 2005-06. (4) Around 65 per cent of this increase was directly borne by the WA Government rather than the Australian Government or private sources.
Between 2003-04 and 2005-06 the proportion of WA public hospital funding provided by the Australian Government fell markedly from 48.3 per cent to 42.9 per cent. This fall was, in part, made up by the WA Government, whose contribution rose from 48 per cent to 50.9 per cent. This represented an increase of 27 per cent in WA Government expenditure on public hospitals to $1,141 million. Over the same period the total funding from non-government sources doubled to $140 million to make up 6.3 per cent in 2005-06. (5)
As with other states and territories, the Australian Government makes a substantial contribution to the funding of public hospitals in WA. This funding is provided under the Australian Health Care Agreement (AHCA). Like other states, the funding of public hospitals has been an increasing burden on the WA Government.
While some of the figures quoted above exclude government expenditure on public patients treated in private hospitals, other data reveals that between 2003-04 and 2005-06 the WA Government increased the amount it spent treating public patients in private hospitals by 20 per cent to $202 million. (6)
The increasing cost that public hospital services represent for the WA Government emphasise how important the performance of the sector is for the long term fiscal viability of the state government budget, to say nothing of the health and wellbeing of West Australians. It is in the interests of every Western Australian that the public hospital system provides value for money while achieving quality and safety standards.
As at 30 June 2006, the population of WA was estimated at just over two million people or approximately 9.9 per cent of Australia's population. (7) WA is by far the most sparsely populated state with an average of only 0.8 people per square kilometre compared to an average of 2.6 people per square kilometre for Australia as a whole.
Almost 8 per cent of WA's population lives in areas classified as remote or very remote. This compares with just 2.3 per cent of Australia's total population. WA also has a significant indigenous population resident throughout the state. Hence WA faces a significant challenge in the delivery of health services, particularly public hospital services to remote areas. While these are recognised as significant issues, they are not the focus of this report.
Profile of public hospitals in WA
There are now 95 public hospitals in WA. (8) It is important to note that this figure and much of the publicly available data on public hospitals in WA excludes both the Joondalup and Peel Health Campuses. These hospital operations are run by private operators who were first contracted to provide public hospital services on an ongoing basis under the then Court Government. These hospitals continue to be contracted to the WA Government to provide services to public patients.
According to AIHW figures in 2005-06, the 91 public hospitals in WA had 4,984 available beds (including psychiatric hospitals). (9) This figure excludes the beds available to public patients through the Joondalup and Peel Health Campuses. If these two campuses are included a further 409 beds were available to public patients.
As noted earlier, WA is a sparsely populated state with unique challenges in Australia in terms of the delivery of health services in remote locations. The distribution of beds by size of hospital, as shown in Figure 1, reflects this.
Figure 1: Available Public Hospital Beds by Hospital Size, 2005-06, %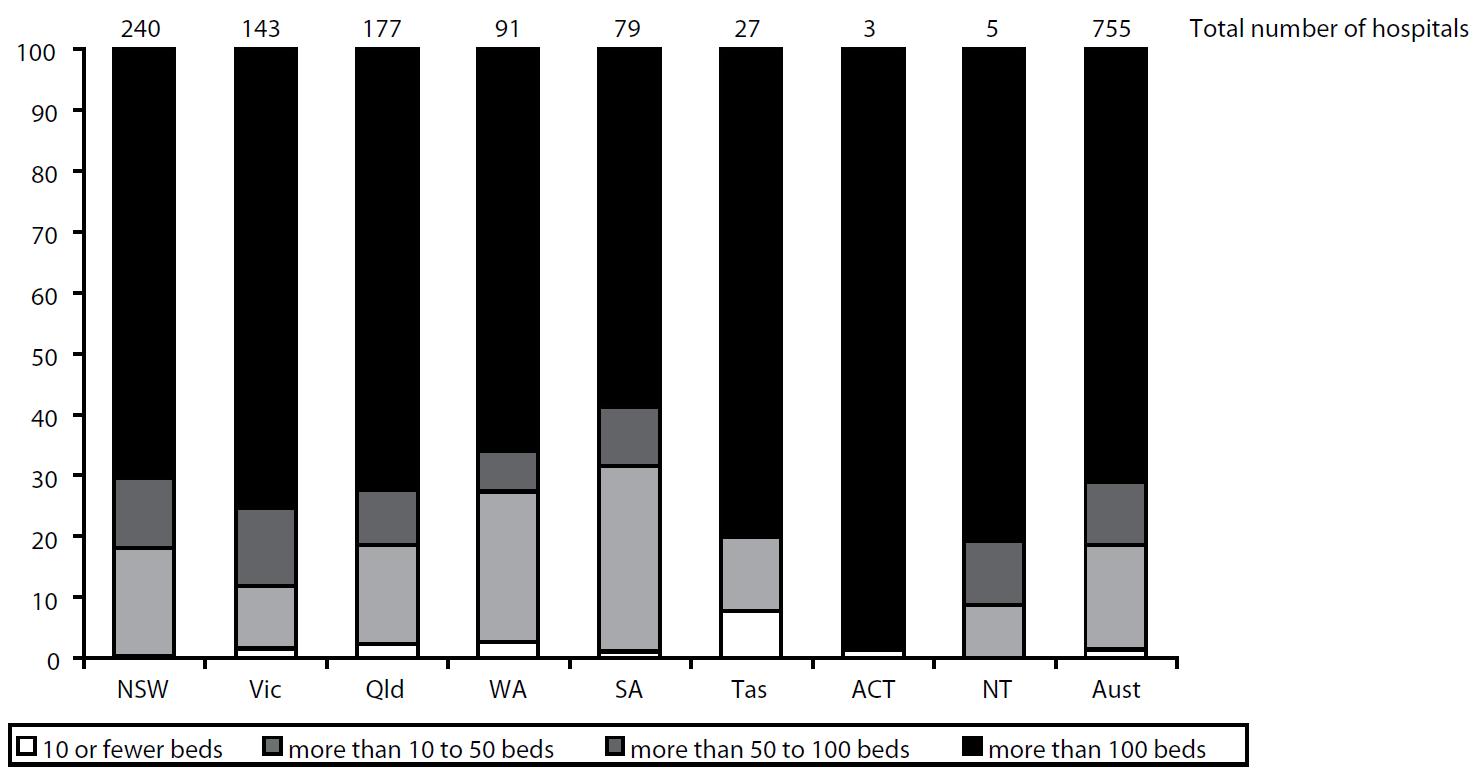 Note: WA figures exclude beds in private hospitals that provide services to public patients. Includes psychiatric hospitals.
Source: Report on Government Services 2008, Productivity Commission.
According to Figure 1, WA has one of the least concentrated public hospital systems in Australia. In 2005-06, only 66 per cent of the available public hospital beds in WA were in hospitals with more than 100 beds. On this measure WA is second only to South Australia (58.7 per cent) for the tendency to have hospital beds in hospitals with fewer than 100 beds. WA is also lower than the Australian average of 71.1 per cent and as an example, even lower than Victoria (10) at 75.3 per cent.
The measure of available beds in hospitals with fewer than 50 beds confirms that the WA public hospital system is diffuse relative to public hospital systems in other states. On average across Australia, 18.6 per cent of public hospital beds are in hospitals with fewer than 50 beds. WA has the second highest proportion of beds in smaller hospitals with 27.3 per cent.
To illustrate what this means for the distribution of hospital beds in WA, if WA were to add beds into larger hospitals to match the proportion of beds that Queensland (11) has in hospitals with more than 50 beds it would entail opening a further 435 beds in hospitals with more than 50 beds. This figure represents approximately 10 per cent of the total number of available overnight beds in all of WA in March 2007, or almost 15 per cent of the overnight beds available in metropolitan Perth. (12)
These figures confirm that the delivery of health services in remote areas is a challenge for the WA Government, and further, that it is likely to have cost, quality and service availability implications in public hospitals unable to achieve critical mass and/or economies of scale. These figures also raise the question of whether optimal trade-offs are currently being made between the provision of hospital services and the use of communications to deliver health services and/or the transportation of patients to larger hospital centres for treatment.
The public hospital bed profile in WA does not include the hospital beds available to public patients at Joondalup and Peel Health Campuses. If beds at these facilities available to public patients are included, the number of beds in WA public hospitals with more than 100 beds increases only slightly from 66 per cent to 68.5 per cent. Even after this adjustment (compared to the Australian average of 71.1 per cent) WA still appears to have smaller than average hospitals.
PART TWO
WA PUBLIC HOSPITALS -- HIGHLY AVAILABLE?
According to AIHW data the number of available public hospital beds per 1,000 people in WA has been decreasing relative to the average across Australia since 2001-02. This is shown in Figure 2.
Figure 2: Available Beds in Public Hospitals Per 1000 People Note: WA figures exclude beds available to public patients at Joondalup and Peel
Health Campuses, total for WA is 2.7 in 2005-06 if these beds are included.
Source: Report on Government Services 2008, Productivity Commission.
Figure 2 shows that the number of available public hospital beds in WA has decreased from 2.7 for every 1,000 people in 2001-02 to 2.5 in 2005-06. This would imply that if Western Australian residents are receiving the same standard of care as that of residents in other states, all else being equal, that WA public hospitals are more efficient. Specifically they either admit patients at a lower rate and/or treat patients in a shorter time frame.
It should however be noted that if public hospital beds available at the Joondalup and Peel Health Campuses are included the number of available beds in WA per 1,000 people in 2005-06 rises to 2.7. (13) On this basis the public hospital beds available in WA is equal to the Australian average.
More recent data released by the Australian Government's Department of Health and Ageing, shown in Figure 3, suggests that the number of public hospital beds in WA is in fact above the Australian average. (14)
Figure 3: All Hospitals -- Average Available Beds per 1,000 Weighted
Population, States and Territories, 2006-07 Source: The State of Our Public Hospitals, June 2008 Report, Department of Health & Ageing, Australian Government.
According to Figure 3 in 2006-07 the number of public hospital beds in WA per 1,000 of weighted population was 2.7 compared with the Australian average of 2.6. On this basis, WA has the third highest availability of public hospital beds of any state or territory in Australia. Given that the distribution of hospital beds continues to favour smaller facilities, as shown earlier, these beds are not necessarily effectively used. Recent data published by WA Health appears to confirm this. There are more than 1,200 overnight beds available in country areas of WA. Over the last two years these beds have had average occupancy rates no higher than 52 per cent. This compares with the 3,000 or so overnight beds in metropolitan areas which have had average occupancy rates consistently above 90 per cent. (15)
Figure 3 also reveals an interesting aspect of the WA hospital system. WA is behind only Tasmania and Queensland in the number of private hospital beds per head of population. Not all of these are used to treat public patients.
Figure 3, although sourced from a different publication to Figure 2, appears to have been prepared on a comparable basis. (16) Assuming this is correct, the available public hospital beds at Joondalup and Peel Health Campuses suggest that, relative to other states, WA has a high number of hospital beds available to public patients. Furthermore, WA has increased the number of available beds per head of population in recent years despite the average across Australia declining. This might reflect the increasing investment in hospital facilities in WA over more recent times.
If the beds available through the Joondalup and Peel Health Campuses are included and classified as metropolitan beds, Figures 4 to 6, which exclude these beds, suggest that WA has a lower availability of hospital beds than the Australian average outside of metropolitan areas. Further, this appears to have been the case for sometime. (See Figures 4 to 6)
Figure 4: Available Beds in Public Hospitals in Metropolitan Areas Per 1,000 People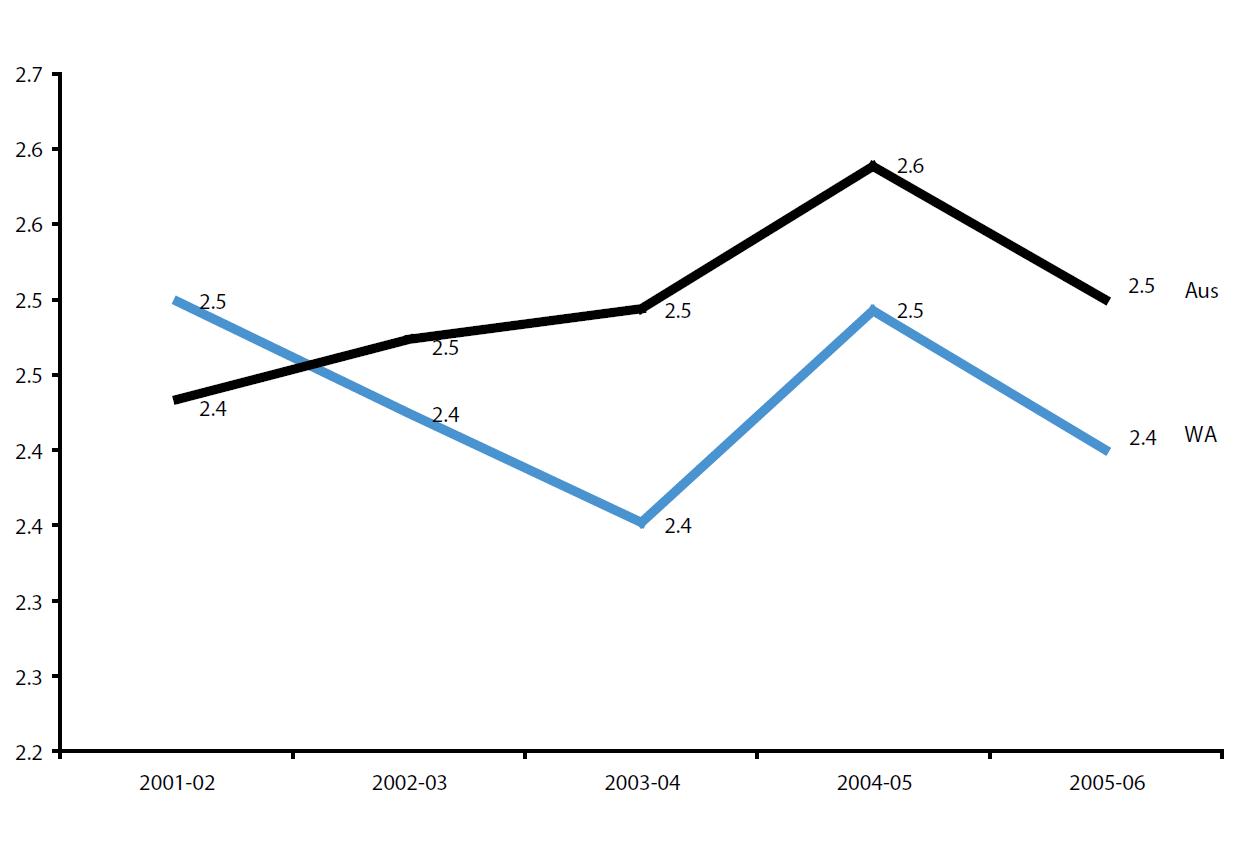 Note: WA figures for 2005-06 exclude beds available to public patients at Joondalup and Peel Health Campuses. If these are included WA is higher than Australian average in 2005-06.
Source: Report on Government Services 2008, Productivity Commission.
Figure 5: Available Beds in Public Hospitals in Regional Areas Per 1,000 People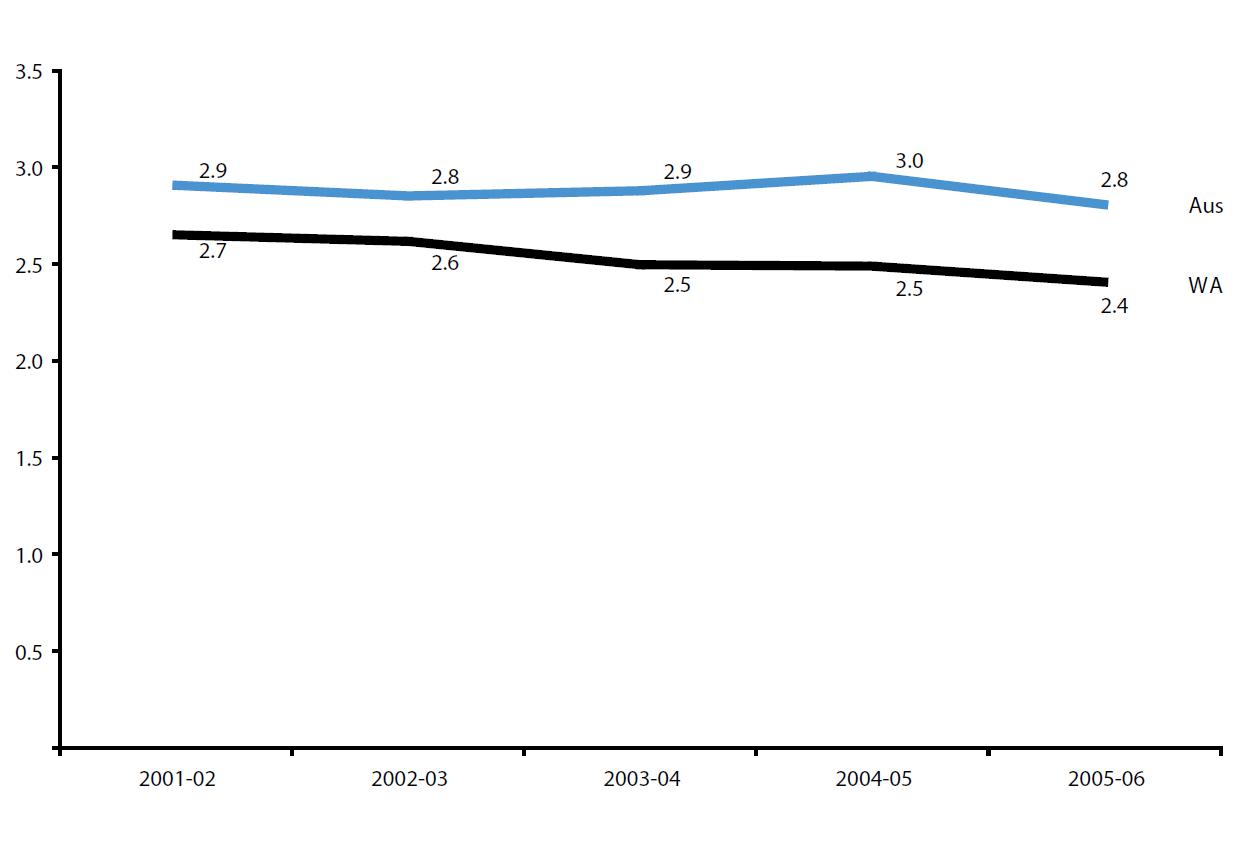 Note: WA figures exclude beds available to public patients at Joondalup and Peel Health Campuses.
Source: Report on Government Services 2008, Productivity Commission.
Figure 6: Available Beds in Public Hospitals in Remote Areas Per 1,000 People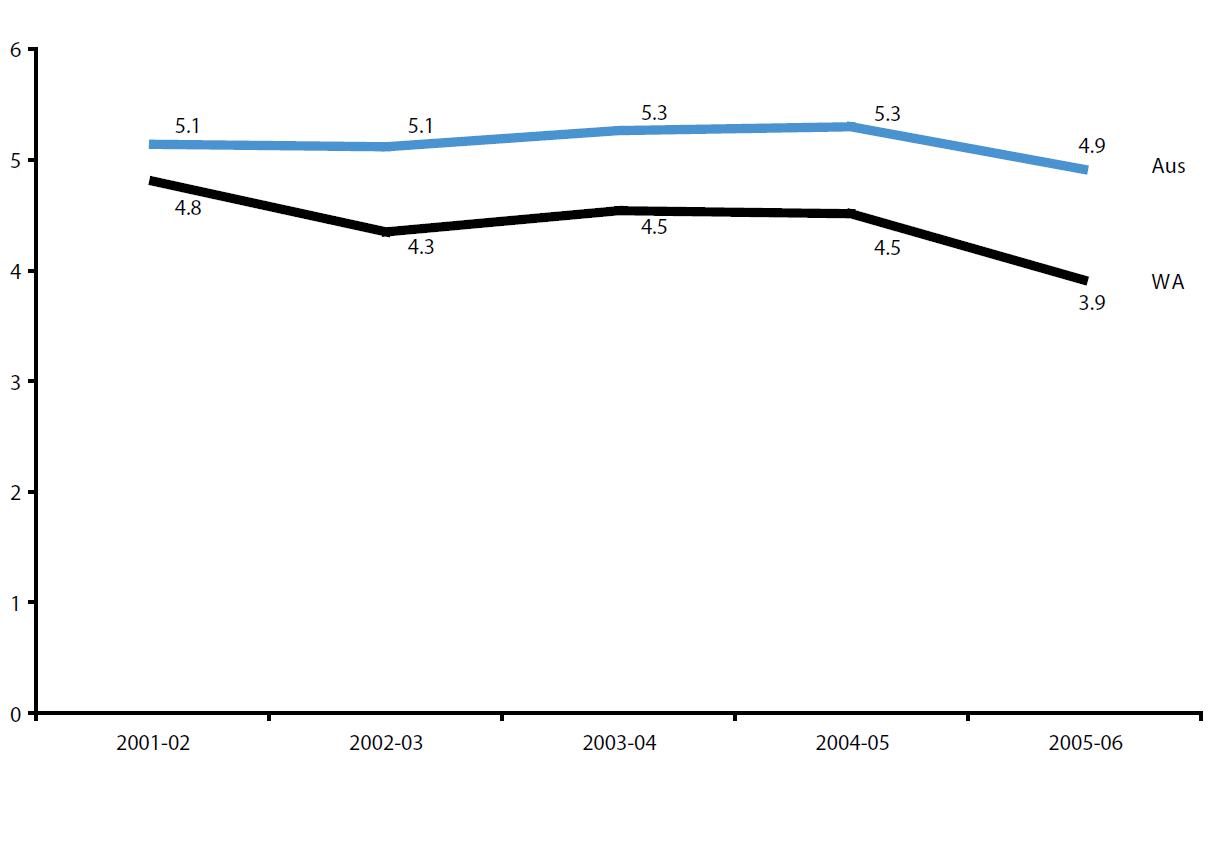 Source: Report on Government Services 2008, Productivity Commission.
If the beds available at Joondalup and Peel Health Campuses are included the number of beds per capita in Western Australia in 2005-06 was the same as in 2001-02. Together with Figure 4 this implies that there are now more public hospital beds available (including those privately provided) in metropolitan areas than in 2001-02. It also implies that in contrast to regional and remote areas where WA bed availability is below the Australian average, in the Perth metropolitan area (including privately provided beds) the availability of public hospital beds is high relative to other metropolitan areas throughout Australia, and may even be the highest.
PART THREE
WA PUBLIC HOSPITALS -- LESS FREQUENTLY SEPARATED?
In 2005-06, WA had a below average rate of public hospital separations at 195.7 public hospital separations per 1,000 people compared to the Australian average of 212.8. This is shown in Figure 7.
Figure 7: Total Public Hospital Separations, Rate per 1,000 people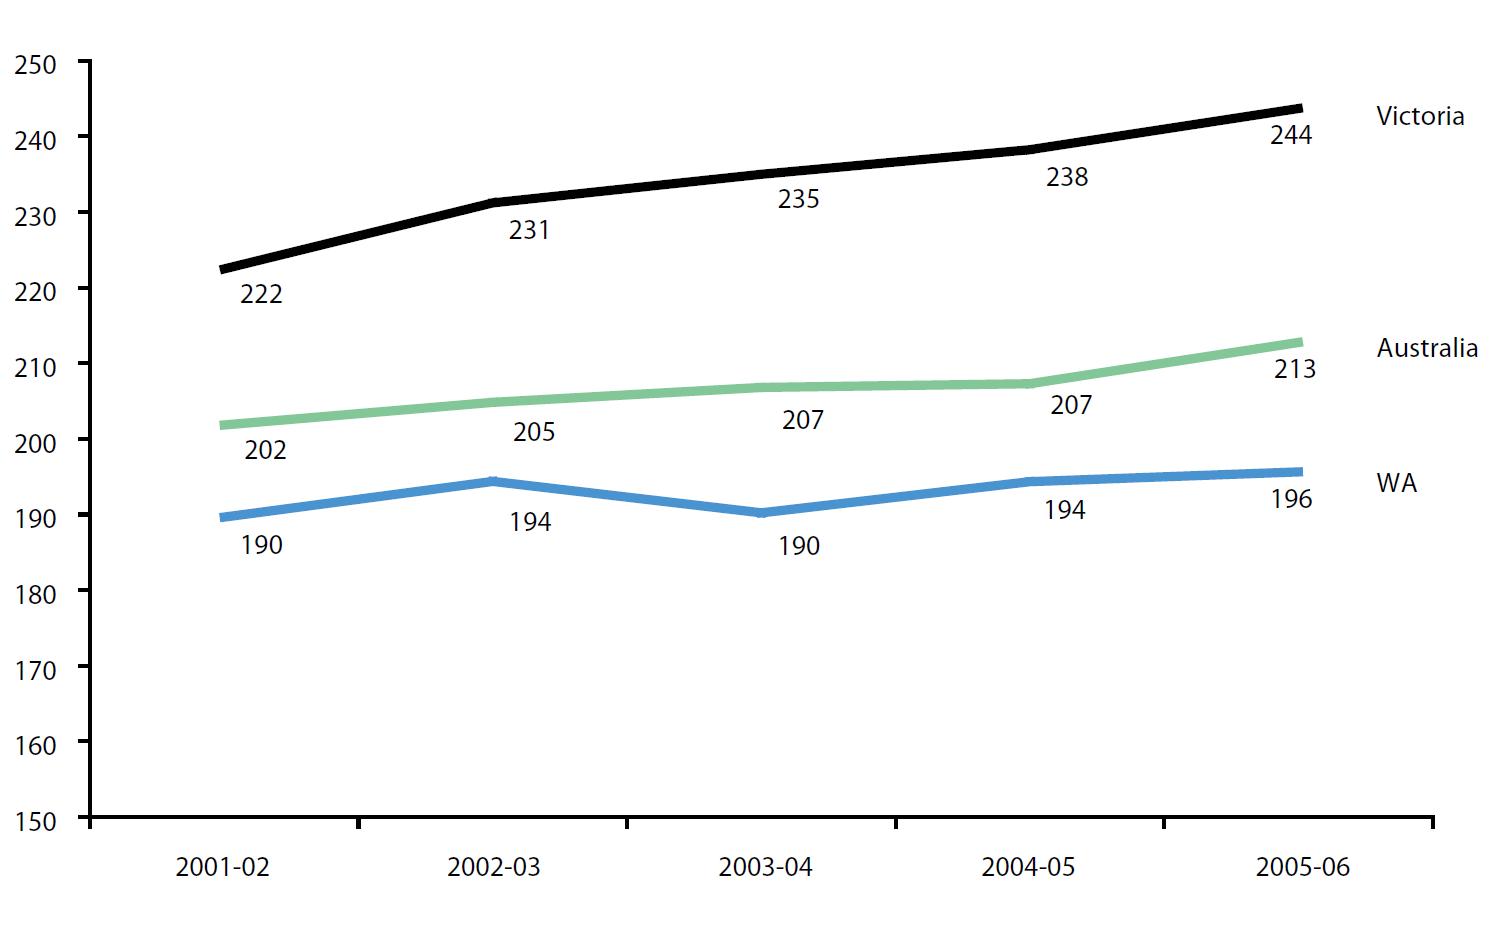 Note: Rates per 1,000 people are directly age standardised to the Australian population at 30 June 2001. Excludes Private Hospitals serving public patients and psychiatric separations.
Source: Report on Government Services 2008, Productivity Commission.
Figure 7 shows that the rate of public hospital separations in WA increased by less than 5 per cent over the five year period from 2001-02 to 2005-06. Over the same period, the average public hospital separation rate across Australia increased roughly in line with WA.
The rate of public hospital separations in WA was consistently lower than the Australian average, even after adjustment for the variation in age profiles between states. Of all states and territories, only Tasmania had a lower separation rate than WA in 2005-06 and was less than 2 per cent below WA.
The lower separation rate in WA might reflect a greater use of hospital-in-the-home treatment in WA than elsewhere. However, according to recently published data, hospital-in-the-home services represented less than 1 per cent of public hospital separations in WA. (17) This compares with more the same service making up more than 3 per cent of separations in Victoria.
The separation rate in WA is likely to be underestimated because public patients who receive treatment as public patients in private hospitals, as with other similar data, are assumed not to be included.
The lower than average separation rate in WA combined with the relatively high number of available hospital beds in the Perth metropolitan area might suggest hospital resources are not optimally allocated or managed. Consideration of additional data will further inform this view.
PART FOUR
ONE MEASURE OF EFFICIENCY -- NO SLEEPOVERS OR KICKING THE PATIENT OUT
The proportion of public hospital separations which are same day and do not involve an overnight stay is a possible proxy for efficiency in public hospital treatment. Figure 8 shows the trend of same day separations in WA public hospitals. As a proportion of all separations, same day separations in 2005-06 made up 50.8 per cent of public hospital separations in WA. This put WA above the Australian average of 49.7 per cent. While WA is above average on this measure it performs well below other states. For example, Figure 8 shows that Victoria, with 55.9 per cent in 2005-06, has consistently maintained a proportion of same day separations more than 5 per cent above WA. Some of this may be attributable to the higher use of hospital-in-the-home services in Victoria. However, as much as 3 per cent or three fifths of the difference remains to be explained. It is an open question as to whether Victorian public hospitals are more efficient at treating patients or have a markedly different patient profile to WA public hospitals.
Figure 8: Same Day Public Hospital Separations, % of Total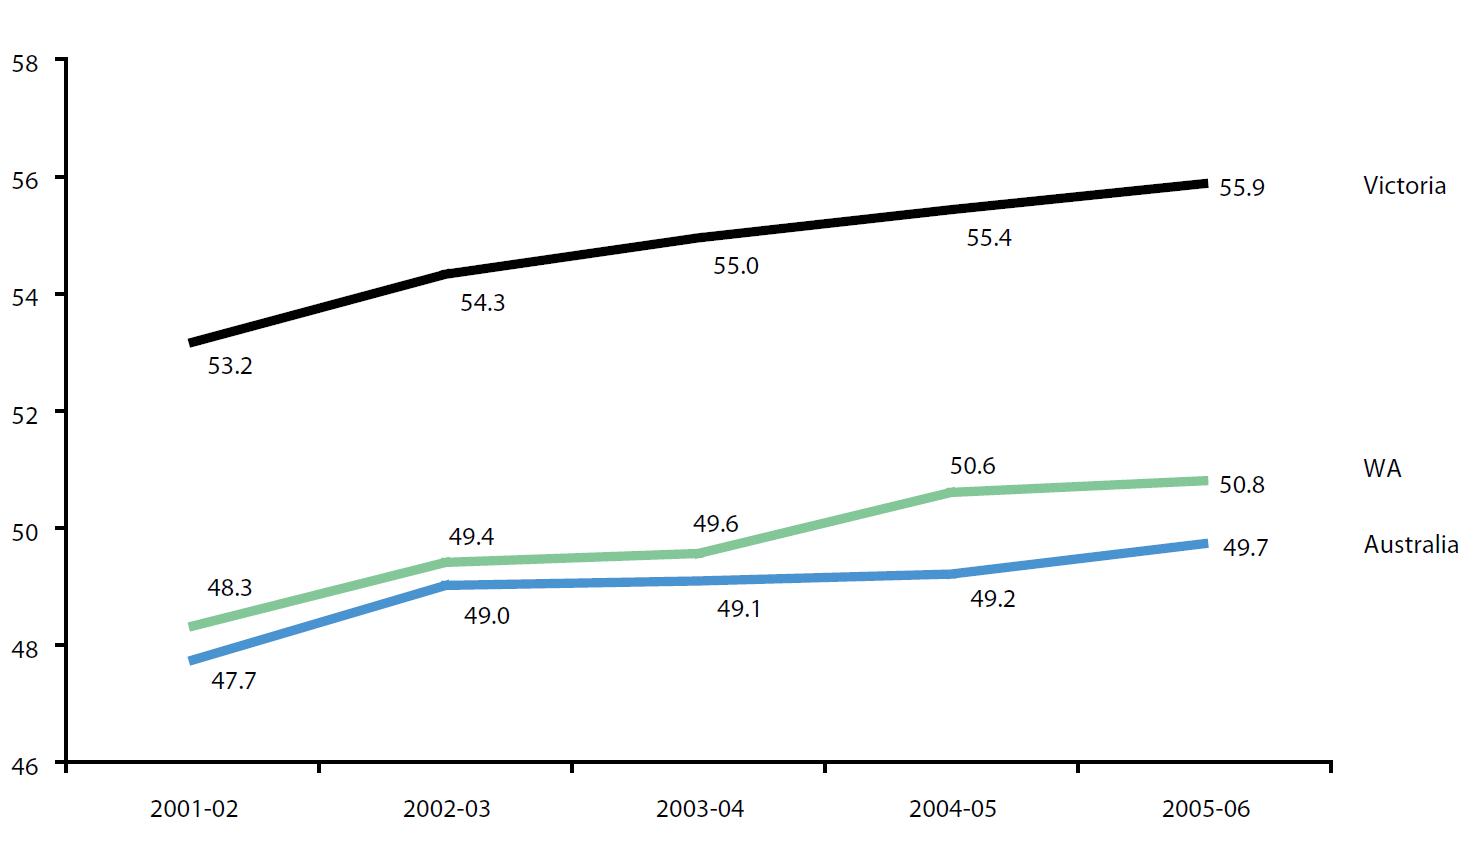 Note: Only public hospital separations, excludes psychiatric separations.
Source: Report on Government Services 2008, Productivity Commission.
Some of the difference in the rate is likely to be attributable to WA patients treated as public patients in private hospitals. The rate of same day admissions in WA private hospitals in 2006-07 was 62 per cent. (18) Given the secondary rather than tertiary nature of the services provided to public patients by private hospitals in WA, this is likely to explain some of the differential rates.
Despite this plausible explanation, the differential merits further investigation given that it has risen over time across Australia, Victoria and WA. Recently published data for 2006-07 suggests that the same day separation rate in public hospitals in WA has further increased to 52 per cent while Victoria has held relatively constant at 56 per cent. (19)
Given improvement has been observed in the past, the remaining 4 per cent differential rate between WA and Victoria may represent a significant potential efficiency for public hospitals in WA.
The "relative stay index" is a further indicator of the relative efficiency of public hospitals. Unlike the measure of same day separations, the relative stay index accounts for the varying case mix of hospitals in each state and territory but does not adjust for other factors that may be relevant.
The relative stay index of WA public hospitals compared to other state and territories is shown in Figure 9. The "relative stay index" for all public hospital patients in WA shown in Figure 9 commends the efficiency of public hospitals in WA. According to the construction of the index, an index value less than 1 suggests WA public hospitals are more efficient at managing length of stay for their case mix than would normally be expected.
Figure 9: Relative Stay Index All Patients in Public Hospitals, 2005-06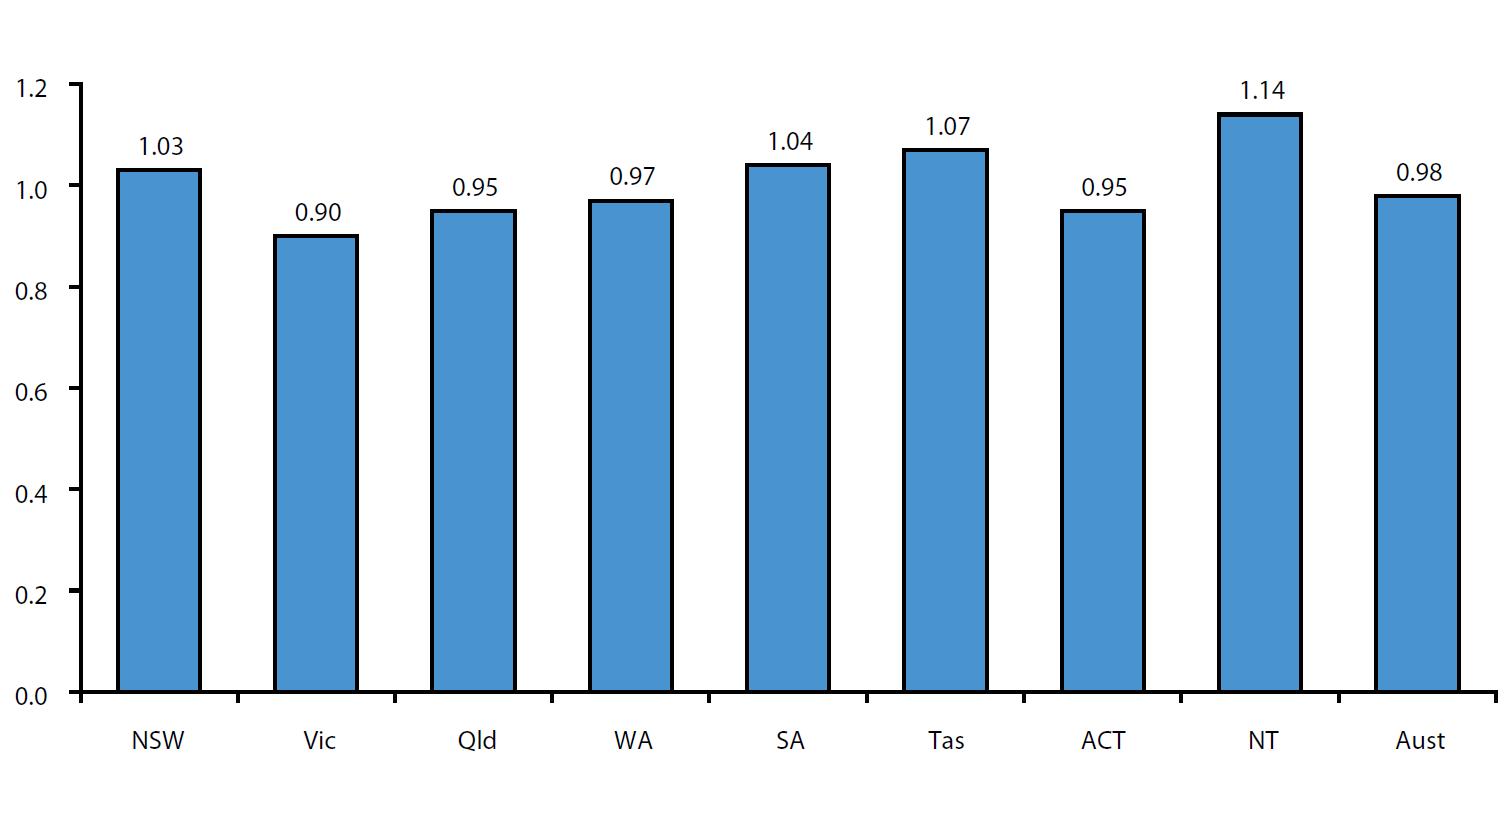 Source: Report on Government Services 2008, Productivity Commission.
Figure 9 shows that WA public hospitals, with a relative stay index of 0.97 perform close to average for public hospitals in Australia (0.98) relative to the expectations for their case mix. However, WA public hospitals are only performing close to average. On this measure they do not appear to be achieving best practice. In comparison to WA, Victoria achieves a relative stay index of 0.90, almost 10 per cent below that of WA.
It is a moot point as to whether the comparative health outcomes of Victorian public hospitals compared to WA public hospitals betrays any detrimental effects from Victoria's low relative stay index and the efficient performance implied therein.
A comparison of the relative stay index in WA public hospitals by diagnosis group with other states and territories (see Figure 10) endorses the earlier hypothesis that WA public hospitals have room for improvement.
Figure 10: Relative Stay Index All Patients in Public Hospitals, 2005-06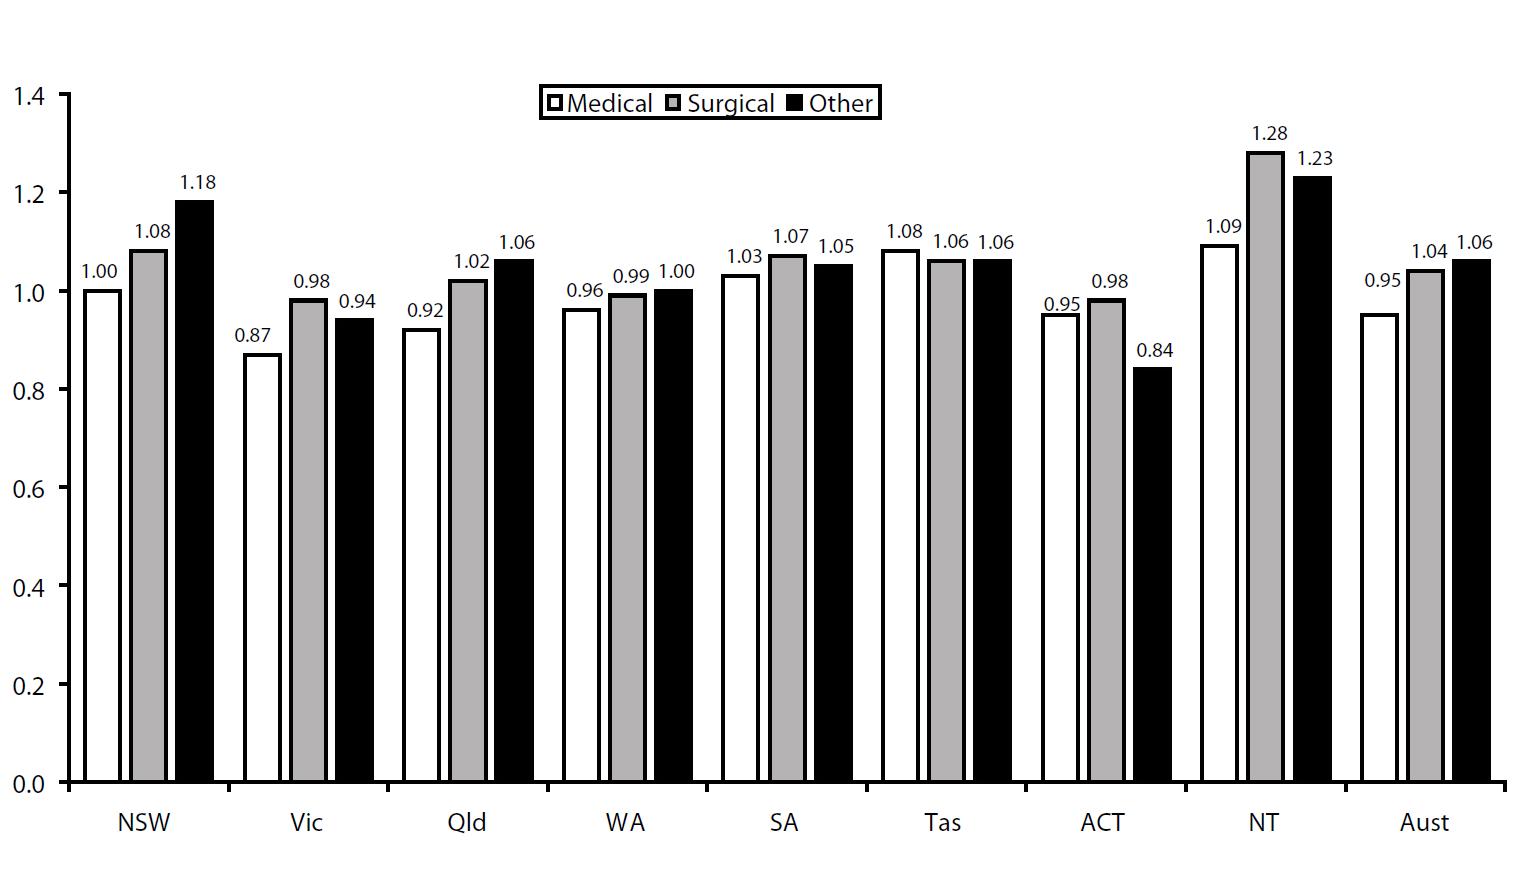 Note: The relative stay index as shown is indirectly standardised.
Source: Report on Government Services 2008, Productivity Commission.
Although WA public hospitals may be more efficient than the average for Australia on this measure, they do not appear to be achieving the shortest stays on any type of treatment when compared to other states and territories.
Figure 10 suggests that the performance of WA public hospitals is approximately what is expected for the case mix in WA public hospitals. For medical diagnoses, WA achieves a relative stay index of 0.96. The ACT, Queensland, and Victoria all achieve lower index values on this medical measure.
When WA is compared with Victoria (20) there is a sizable difference between both medial diagnosis and other diagnosis types. On surgical diagnoses, WA public hospitals are only marginally less efficient than Victoria and the ACT, and more efficient than all other states and territories.
On balance, there appears to be an opportunity to achieve greater efficiencies in treating medical diagnoses on the basis that Victorian public hospital figures are substantially lower. In general, the performance of WA public hospitals in achieving efficiencies through length of stay appears to be slightly above average.
The above discussion is subject to qualifications concerning the available data. The classifications of patients as same day admitted patients or outpatients varies between states. This variation affects the comparability of both the rate of same day admissions and the relative stay index. In 2005-06, WA public hospitals (including public patient activity at Joondalup and Peel Health Campuses) provided 4.48 million non-admitted occasions of service. (21) Based on the proportion of all occasions of service made up by the ten most common types of non-admitted patient care it appears unlikely, though it is a matter for judgement, that the measures evaluated in the preceding discussion would not be significantly distorted by the classification of outpatients in WA relative to public hospital systems in other states and territories. (22)
An additional measure of efficiency and quality is the rate of unplanned readmissions. According to unpublished data from the Australian Council on Healthcare Standards (ACHS), the rate of unplanned readmissions in those WA public hospitals reporting to the ACHS is below the rate of public hospitals in other states and territories. Although this data is not strictly comparable, the rate in WA (inclusive of the standard error) is outside the values (also inclusive of standard error) of other states and territories. (23)
PART FIVE
WA PUBLIC HOSPITALS -- COSTLY, BUT ONLY SLIGHTLY MORE THAN AVERAGE
Expenditure on public hospitals makes up a significant portion of the WA Government budget as discussed earlier. Hence, cost efficiency and value for money are obviously important principles in assessing the performance of WA public hospitals. This consideration in no way diminishes the importance of other measures of quality and performance, but it is difficult to argue that public hospitals should not deliver value for money, however measured.
WA public hospitals, in terms of cost per case mix adjusted separation, are only marginally more costly than the Australian average. Cost per case mix adjusted separation is calculated using the total cost divided by the number of separations adjusted to account for the relative complexity of different episodes of care. This measure provides for a reasonable comparison of hospital cost efficiency between jurisdictions based on the specific types of medical cases encountered rather than merely average case mixes.
The total recurrent cost per case mix adjusted separation for WA public hospitals (labour and materials) in 2005-06 was $3,734, as shown in Figure 11.
Figure 11: Recurrent Cost (Labour and Materials) Per Case Mix Adjusted Separation
for Selected Public Hospitals, 2005-06, $ Note: Figures include selected public hospitals only, focussing on public hospitals providing acute care.
Source: Report on Government Services 2008, Productivity Commission.
WA compares somewhat favourably with the Australian average of $3,698 per case mix adjusted separation. WA public hospitals are only 1 per cent above the average cost per case mix adjusted separation for public hospitals across Australia.
The 2008 WA Budget Papers for WA Health (24) estimate that the average cost of an admitted public patient treatment episode in private hospitals was $2,092 in 2007-08. This compared to an estimated average cost per case mix adjusted separation for non-teaching hospitals in the same period of $4,825. Despite these figures not being directly comparable they suggest a large cost efficiency difference between public and private hospitals in treating public patients. The significance of this differential will be further discussed later in the paper.
Figure 11 shows that in 2005-06 WA public hospitals were fourth lowest in terms of labour costs per separation. Labour costs in WA public hospitals were 4 per cent above the Australian average in 2005-06, 12 per cent higher than Queensland and 6 per cent higher than Victoria. Given the labour market pressures being felt across the WA economy, labour costs may have increased relative to other states since this time. Medical labour costs in WA public hospitals per case mix adjusted separation in particular were 7 per cent higher in 2005-06 than the average for Australia. (25)
The relative makeup of the WA public hospital workforce varies compared with the average across Australia and particularly in relation to Victoria, which achieves lower labour costs per separation than WA. As Figure 12 shows, in 2006-07, WA had a slightly higher proportion of its public hospital workforce in administrative and clerical roles and a substantially higher proportion of staff in roles designated as personal care, domestic and other staff.
Figure 12: Proportion of Total FTE Staff in Public Hospitals by Designation,
Selected States, 2006-07, % Source: The State of Our Public Hospitals, June 2008 Report, Department of Health and Ageing, Australian Government.
Relative to both the Australian average and Victoria in 2006-07, WA had a lower proportion of the public hospital workforce made up of nurses and diagnostic and other health professionals. The WA workforce distribution differential shown in Figure 12 across workforce classifications may be a factor contributing to the higher than average labour cost per separation for WA public hospitals. This would appear to be an area worthy of further consideration in the pursuit of greater cost efficiency.
In contrast to its relative labour costs, on material costs per case mix adjusted separation WA public hospitals were the second lowest in Australia being 6 per cent lower than the Australian average. Only South Australia was lower.
If Victoria is used as the benchmark, WA costs (labour and materials combined) could improve by around 2.3 per cent across the hospital system, assuming that labour costs can be reduced through productivity improvements rather than lower salary costs.
As shown in Figure 13, in comparison with other states and territories, in 2005-06, WA had the fourth lowest capital cost per case mix adjusted separation at $396 per separation.
Figure 13: Capital Cost Per Case Mix Adjusted Separation
for Selected Public Hospitals 2005-06, $ Source: Report on Government Services 2008, Productivity Commission.
The capital cost in WA public hospitals was approximately 5 per cent below the average for Australia at $426. The 2005-06 Australian average may not be representative of the capital efficiency that is possible in public hospitals, as it includes two outliers in Queensland at $649 and the Northern Territory at $548. Given the significant capital program being undertaken by the WA Government there is a risk that the capital efficiency of WA public hospitals will deteriorate if these investments do not most effectively address capacity needs.
On a combined measure of recurrent and capital costs per case mix adjusted public hospital separations WA ($4,130) performs very close to the Australian average ($4,124). On this measure, the total case mix adjusted cost per separation for WA is less than 1 per cent higher than the Australian average, further suggesting that the cost efficiency of WA public hospitals is reasonable but perhaps slightly less efficient than it might be compared to other states.
Comparing recurrent costs in WA public hospitals with the Australian average across hospital peer groups, as in Figure 14, WA exhibits varying performance.
Figure 14: Recurrent Cost per Case Mix Adjusted Separation
by Hospital Peer Group, 2005-06, $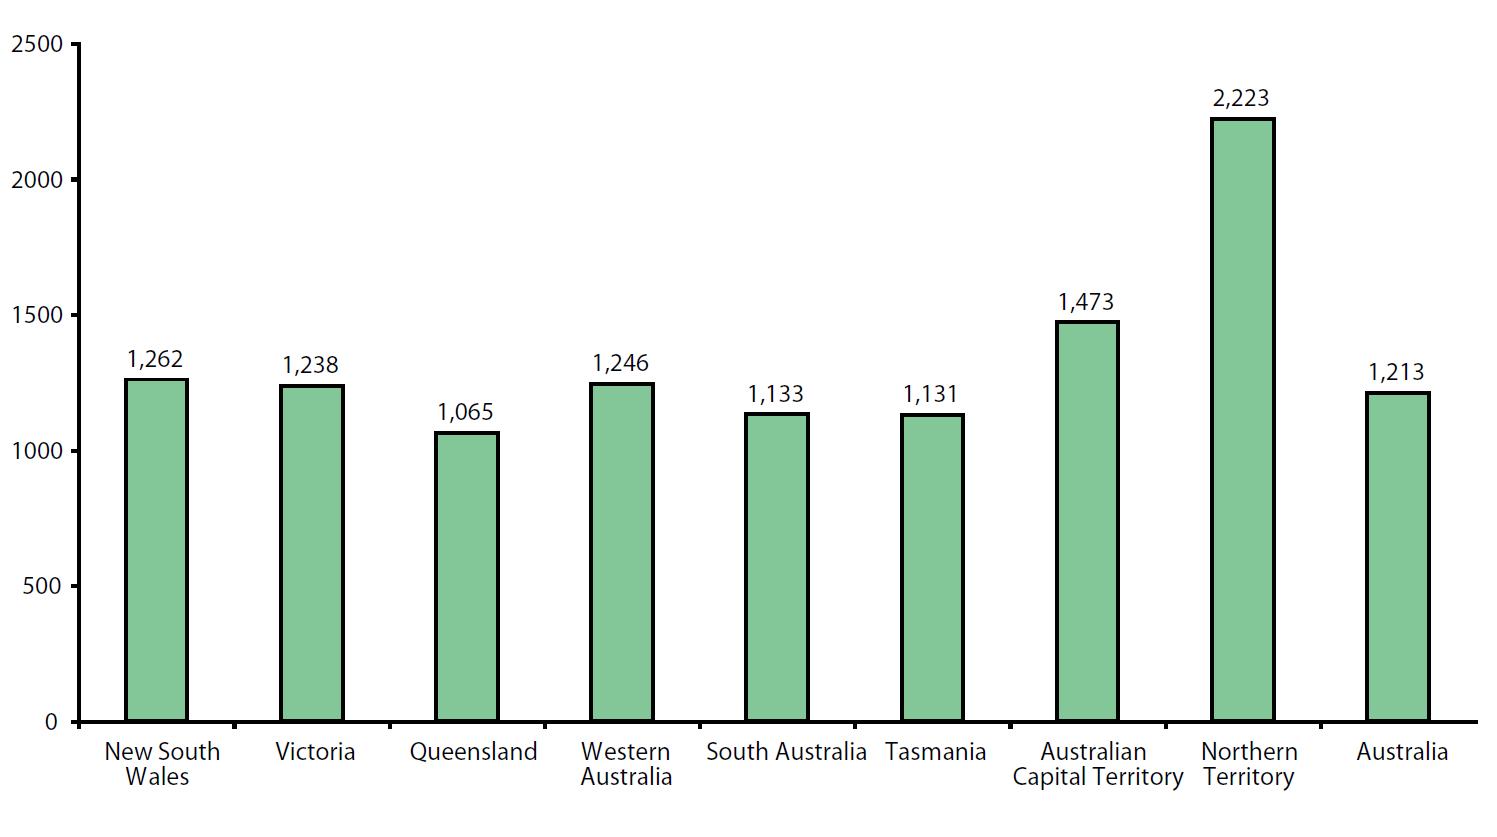 Note: Medium denotes a hospital with between 2,000 and 10,000 acute weighted separations. Small is less than 2,000 acute weighted separations. Large includes regional hospitals with more than 8,000 acute weighted separations and remote hospitals with more than 5,000.
Source: Report on Government Services 2008, Productivity Commission.
Comparing principal referral and specialist women's and children's hospitals in WA (of which four were included in the analysis) with other similar hospitals across Australia, WA achieved a marginally lower cost per separation in 2005-06. Teaching hospitals in WA also achieve a cost per case mix adjusted separation slightly lower than the Australian average. In contrast, across large, medium and small acute hospitals, WA public hospitals are more expensive than the Australian average. This is particularly true for medium and small acute hospitals where the difference per separation is around $500, equivalent to a differential of more than 10 per cent.
This sizable differential in part reflects the much lower bed occupancy rates achieved in hospitals outside of the Perth metropolitan area, as described in the WA Health Performance Report. It may also be in part attributable to the unique challenges WA faces as a sparsely populated state in providing health services in non-metropolitan areas.
Figure 14 does suggest that there are hospitals in WA which are not operating as efficiently as the Australian average suggests is possible. This obviously has implications for the costs that the WA Government will bear in the future.
Overall in terms of public hospital costs based on more recent data, Figure 15 shows that in 2006-07 WA has a higher recurrent expenditure per person on public hospital services at $1,246 than the Australian average at $1,213. (26)
Figure 15: Recurrent Expenditure per Person on Public Hospital Services,
Weighted Population, States and Territories, 2006-07, $ Source: The State of Our Public Hospitals, June 2008 Report, Department of Health and Ageing, Australian Government.
According to this recent data, in 2006-07 WA spent more on public hospital services than all other states except NSW. Given the preceding analysis that suggests that relatively higher costs in WA may be attributable to particular hospital peer groups, it is arguable that the relatively higher costs may only reflect challenges in service delivery unique to WA, all else being equal.
PART SIX
WA -- A QUALIFIED ENDORSEMENT OF PERFORMANCE
Based on the preceding assessment of a selection of publicly available data the WA public hospital system receives qualified endorsement. On none of the measures considered does it appear to be dramatically under-performing, with the possible exception of non-metropolitan bed occupancy rates and costs in smaller hospitals. Neither, however, on any of the performance measures does it appear particularly distinctive in its high achievement.
There are areas such as the distribution and availability of hospital beds where it is plausible to interpret the data as suggesting that the public hospital system in WA is trading off efficiency for policy objectives such as health service provision in regional and remote areas, and ensuring the high availability of services.
The relatively different profile in WA public hospitals away from nurses and diagnostic professionals towards administrators and personal carers is also a fact that may be worthy of further investigation.
PART SEVEN
INITIATIVES FOR REFORM -- CONTINUED LEADERSHIP IN PRIVATE PROVISION
Despite the qualified, overall positive assessment of the WA public hospital system, there is one area in particular in which WA is undisputedly a leader in Australia. That leadership consists of the use of private hospitals to provide for public patients. While this is a legacy of the former Court Government, current investment and continued contractual relationships suggest that it continues to be a deliberate policy setting by the subsequent Gallop and Carpenter Governments.
Figure 16 demonstrates two important facts in relation to the use of private hospitals to treat public patients in WA.
Figure 16: Total Expenditure on Private Hospitals by WA Government and
Proportion of Total State Government Expenditure on Private Hospital Services by
WA Government, 2003-04 to 2005-06, $ million, % Source: Health Expenditure Australia 2005-06, Tables A1-A3 and B10-B12.
Over the period shown in Figure 16, expenditure on private hospitals by the WA Government to provide services for public patients has been significant, starting at $169 million in 2003-04. Expenditure on private hospitals by the WA Government subsequently grew by almost 20 per cent in the two years to 2005-06 to reach $202 million.
Figure 16 also reveals the extent of the use of private hospitals by the WA Government compared with other state and territory governments around Australia. In 2005-06, of all expenditure by state and territory governments in Australia on private hospitals the WA Government was responsible for 83 per cent of the total.
Figure 17 further demonstrates WA's leadership in the use of private hospitals to care for public patients. In 2005-06, 15 per cent of WA Government expenditure on hospital services was directed to private hospitals. This is significantly more than the average state or territory government. On average, state and territory governments across Australia spent only 1.9 per cent of their hospital budget on private hospitals to provide for public patients in 2005-06.
Figure 17: Proportion of State and Territory Government Total
Hospital Expenditure on Private Hospitals, 2005-06, % Source: Health Expenditure Australia 2005-06, Tables A1-A3 and B10-B12.
Unfortunately, publicly available data does not allow for a full comparison of the cost efficiency, quality and safety of WA public hospitals compared to the privately run facilities operating in WA which are used to provide treatment for public patients. However, based on information that is available in relation to the performance of the Joondalup and Peel Health Campuses, these privately managed operations appear to be responsible for substantially reducing the cost of hospital services to the WA Government.
For the services that they do provide, they would appear to perform on a comparable basis to WA public hospitals with the exception of costs. As stated earlier, although the available figures are not directly comparable, both the Joondalup and Peel Health Services would appear to be significantly more cost effective for the treatments they provide to public patients than alternate public hospitals. (27)
The Reid Report (28) noted that 80 per cent of admissions to tertiary hospitals in WA were for episodes of care which required only a secondary hospital service. The implication of this finding is that both service quality and cost efficiency can be improved by moving the treatment of a portion of the 80 per cent of admissions identified to secondary hospitals.
In response to this finding, the Reid Report recommended that four secondary hospitals be expanded to approximately 300 bed general hospitals to improve access in areas of population growth and reduce the demand placed on tertiary hospitals. Given what is known about the current use and performance of private management and provision of public hospital services, further use of private providers to supply secondary hospital services to public patients should be considered, if not prioritised, as part of any plan to extend public hospital services in WA.
In the past there have been perceived concerns over the quality and safety of treatment provided by private hospitals to public patients. Independent reports have found no significant issues of concern in relation to these services. (29)
The available evidence reveals that the WA Government is an established leader in the use of private hospitals. Given this leadership and apparent benefits, any expansion of the public hospital system should closely examine the further use of private providers, whether as part of Public Private Partnerships for hospital construction and expansion, as hospital managers, or merely as service providers for the treatment of public patients where appropriate. The experience of WA commends the further use of private hospital provision to achieve cost and quality objectives.
It is an open question as to whether the current political debate over the provision of public hospital services in WA fully recognises the leadership of the WA Government in this area and the success achieved to date. It would appear to be an area where the political leadership in WA can demonstrate even greater leadership in health service provision in WA.
PART EIGHT
INITIATIVES FOR REFORM -- INFORMING THE PATIENT
Over the last few years significant progress has been made on reporting many indicators of performance in WA public hospitals. The WA Health Performance Report, published quarterly, provides detailed information on hospital admissions, bed availability, elective surgery waiting times and treatment times in emergency departments, along with other important measures of performance and quality of service. (30)
The annual reports of the WA Health Department, the Metropolitan Health Service, and the WA Country Health Service also contain detailed and extensive performance information for their respective areas. Recently, the WA Government initiated the "Blitz Program", which provides additional sessions of elective surgery in WA public hospitals. This program has been made possible by an additional $15.4 million provided by the Australian Government for this purpose.
The "Elective Surgery Blitz Report", prepared as a result of this initiative, provides detailed information on the number of patients on waiting lists by surgical specialty, and the number of patients waiting longer than the recommended time for their clinical urgency classification. This information is provided at a hospital level for public hospitals in the metropolitan area (including Peel and Joondalup Health Campuses) and at a regional level in country areas. This information is to be updated on a quarterly basis.
This initiative is a welcome addition to the transparency and accountability of hospital performance in WA. Table 1 summarises all of the performance information available online in relation to public hospitals in each state and territory. (31)
According to Table 1, no individual state or territory provides online reporting for more than half of the parameters listed. WA provides data on 75 per cent of the parameters reported by any state and territory for both "Admissions" and "Emergency Department Care" classifications. This matches or exceeds the data available to describe these areas for every other state and territory. In terms of elective surgery measures, it is also comparable or better than other states and territories. Only NSW and the ACT provide more comprehensive online reporting in relation to elective surgery than WA.
Of particular concern is the lack of online reporting in WA of measures relating to Safety and Quality of Care. Of the five measures in this area, WA had none available online. WA is not alone in this omission of reporting, however this is obviously an important area of hospital performance.
Although data may be recorded and reported at a hospital level it may still be shown as not being available in Table 1. Although Table 1 only shows data that is available online, it is not an irrelevant consideration if the goal is to achieve high levels of public accountability and transparency. Making data available online is not essential to transparency and accountability. However it does have obvious advantages to enable wide accessibility and set high expectations concerning the regular and timely release of data that is up-to-date.
It should be acknowledged that over the past few years WA has made progress in providing more detailed information. However, large gaps remain in the availability of data at a hospital level for public hospitals across WA.
The ACT provides an example of what is possible. ACT residents are able to ascertain online in a matter of seconds the number of sessions of a particular speciality being conducted by individual surgeons at individual public hospitals. At the same time they can find out the waiting time statistics currently applying to that surgeon at that public hospital. (32) Although the ACT is relatively a much smaller public hospital system, information of the same nature is available in the UK for National Health Service facilities. Modern technology should mean that such information can be made available to WA residents.
Anecdotal evidence suggests that public hospital patients in WA can obtain access to such information by drawing on privileged relationships or knowledge. While WA Health makes the commitment to WA public hospital patients that they will refer patients "to the specialty that has the shortest waiting time for elective surgery" (33) at a nearby public hospital individual patients are arguably poorly placed to ascertain the extent to which WA Health is fulfilling this commitment.
Public patients should reasonably expect to have access to measures of safety and quality such as infection rates, specifically at an individual hospital level. Such information was recently the subject of discussion at the Australian Health Ministers' Conference held on 22 July 2008. Reports suggested that the Ministers would make infection rates at a hospital level available. However the communiqué issued after the conference made a far more anodyne statement in relation to such transparency:
"Ministers agreed on the importance of working cooperatively towards a strong national system of health service accountability [the Australian Institute of Health and Welfare performance indicators]. Ministers agreed that this work was crucial to inform the new Australian Health Care Agreement." -- Australian Health Ministers' Conference, Canberra, 22 July 2008
At a hospital level, this information is currently not available even in the Health Service Annual reports. In contrast to the lack of quality and safety measures being reported at the individual hospital level, the Annual Reports of private hospitals in WA that treat public patients report some of these measures.
In the absence of clear public detriment from the regular publication of comprehensive performance measures at the individual hospital level, particularly on quality and safety, WA Health should continue to work towards allowing public patients to be fully informed of quality outcomes and other relevant performance measures. This is another area in which WA should be well placed to demonstrate leadership in the health sector.
Table 1: State and Territory Public Hospital Performance Reporting Online
PART NINE
INITIATIVES FOR REFORM -- VOLUNTARY ELECTRONIC PATIENT RECORDS
The late Dr John Paterson, a former Secretary of the Victorian Department of Human Services, observed more than a decade ago that a single acute event experienced by a patient in Australia might accurately be described as an amalgam of "seven providers, seven partial records, six funding programs, one powerless patient and no outcome measures". The result being that for the patient it appears that "no-one is in charge". (34)
In 2004 the Reid Report noted that "Investment is needed to assist people to navigate the health system. This includes technology to facilitate the movement of information throughout the health system, such as electronic health records and unique patient identifiers…" (35)
Both of these observations highlight the need for patients and all of their medical service providers to have knowledge sufficient to provide the best medical treatment possible. There is evidence that WA Health has made progress on the use of unique patient reference numbers. It has also placed additional emphasis on ensuring that communication between public hospitals and referring GPs or specialists occurs at least in relation to elective surgery.
The availability of a system that allows electronic medical records to be accessed by any relevant health provider, including GP's, specialists and hospitals, would provide significant value for patients and health practitioners. In 1996, Paterson, drawing on an intimate knowledge of the multiple interactions in the health system, laid out a four year reform path that delivered electronic patient records along with other significant reforms to healthcare funding. (36)
The availability of high quality technology, the significant value in terms of the delivery of quality of care and improved co-ordination of treatment commends electronic patient records as a reform that should be further pursued.
The WA Government should examine and facilitate solutions to allow WA patients to voluntarily opt-in to an electronic patient record system with appropriate privacy safeguards that permits access for all healthcare providers. Given that such a system could significantly enhance the quality of healthcare provided to individuals, if obvious obstacles were overcome, it could provide the basis for a transformation in healthcare in WA. This is another area in which WA can demonstrate further leadership in the provision of healthcare.
PART TEN
INITIATIVES FOR REFORM -- WESTERN AUSTRALIA AS A NATIONAL LEADER IN HEALTH REFORM
Total health expenditure in WA from all sources in 2005-06 was $8.8 billion, of which more than $5.6 billion was obtained from government sources. (37) The government component of spending is delivered to patients through a myriad of different and disparate programs numbering in excess of 60. (38)
Figure 18 is an illustrative depiction of the relative sizes from different sources (not identified in the figure) of health expenditure in different areas in WA only. Each bubble represents a single source of funding for one area of health expenditure. The size of each bubble is proportional to the spending from that source in that area. The figure illustrates the complexity of funding sources for different areas of health expenditure in WA, despite the source data aggregating a number of different health programs.
Figure 18: Illustrative Health Expenditure in WA by Funding Source and Area, 2005-06 Source: Health Expenditure Australia, 2005-06.
By far the largest single area expenditures by source are federal and state spending on the public hospital system, federal funding for medical services (under Medicare), medications subsidised by the federal government under the Pharmaceutical Benefits Scheme (PBS) and expenditure by individuals on medications. Expenditure by individuals on dental services and aids and appliances are also significant along with community health expenditure by state and local governments. Expenditure on private hospitals divided between health insurers, the federal government (through the private health insurance rebate) and the WA Government are also shown as sizeable bubbles.
Figure 19 is prepared on the same basis as Figure 18 for total Australian health expenditure. (39) The main difference, other than some apparent changes in the relative spending by area, is the diminished significance of expenditure on private hospitals by state governments.
Figure 19: Illustrative Total Australian Health Expenditure
by Funding Source and Area, 2005-06 Source: Health Expenditure Australia, 2005-06.
Both Figures 18 and 19 include government expenditures made through programs with the aim of improving health outcomes that are variously capped and uncapped. For example Medicare and the PBS are uncapped programs. For these programs there is no meaningful upper limit on the number of services and listed medications for which the Australian Government will subsidise treatment on an individual level. In contrast, government expenditure on public hospitals is capped. The effect of this approach is to create scarcity of supply and generate the elective surgery waiting lists observed around Australia.
The structure of the current health funding arrangements also undoubtedly involves significant inefficiencies. It creates waiting lists in the supply of some areas of healthcare that are likely to contribute to increased costs in government funded programs that are uncapped. The complexity of the system and its general focus on sources of, and conditionality of, funding create significant obstacles for the healthcare system to provide patients with the best levels of care possible.
One possible radical solution suggested by others (40) to address these inefficiencies would be for the WA Government to attempt to pool all or part of the current sources of health care funding. By bringing together the $3.4 billion of recurrent health expenditure from the Australian Government, the $2 billion from the WA Government, and some significant portion of the $2.6 billion from non-government sources a patient-centred system could be created.
The guiding principle would be that the funding pool would allow for the healthcare which most effectively addresses the needs of individual patients. This model could pool all the available funding around an individual patient and provide for their needs irrespective of where, or by whom, the service was to be provided. Such a model could be trialled in some portion of Perth, possibly on a voluntary basis, in an attempt to remove some of the inefficiencies and distortions in the current system.
Such a model, where funding is pooled to cater for individual needs, could provide powerful incentives in relation to preventative healthcare. This might, in part, overcome the problem that currently exists whereby patients may not be entitled to receive funding assistance for health measures which will avoid long-term costs of far greater significance simply as a result of the design of government programs.
The model might beneficially incorporate some form of patient advocate or agent to empower individual patients to be fully informed about their choices and trade-offs and to better navigate the available health services. While the funding pool design and service provision would be radical in comparison to the current system, WA, with its unique outlook in the Australian federation, could possibly instigate a trial as part of the next Australian Health Care Agreement.
The design of such a model requires more explanation and discussion than is possible here. However, such an approach would radically alter the balance in healthcare towards patient-centred provision and build on the leadership that WA has shown in the innovative provision of public hospital services in Australia. Committing to such a trial, with the aim of removing inefficiencies, improving patient outcomes and minimising waiting lists, would constitute a bold act of leadership on behalf of the WA Government.
REFERENCES
1. Health Expenditure Australia 2005-06, AIHW.
2. 2008-09 WA Budget Papers, Part 7, Division 35, Minister for Health -- WA Health, p 560.
3. 2008-09 budget overview, Western Australian Government, 2008, p 6.
4. Health Expenditure Australia 2005-06, AIHW, Table 39.
5. Health Expenditure Australia, 2005-06, Australian Institute of Health and Welfare, Table 39 & 40.
6. Health Expenditure Australia, 2005-06, Australian Institute of Health and Welfare, Table B10–B12.
7. ABS (unpublished) Australian Demographic Statistics, December Quarter 2006.
8. The State of Our Public Hospitals June 2008 Report, Department of Health and Ageing, Australian Government, p 8.
9. Report on Government Services 2008, Productivity Commission.
10. Victoria is used as a relevant benchmark because based on a range of available efficiency and cost measures it repeatedly comes up as a high-performing public hospital system.
11. Queensland is chosen as a plausible target in this case because it has the third lowest population density after South Australia and Western Australia and has only 18.6 per cent of its beds in hospitals with fewer than 50 beds.
12. WA Health Performance Report, January to March 2008 Quarter, p 11. Western Australian Department of Health.
13. Report on Government Services 2008, Productivity Commission.
14. The State of Our Public Hospitals, June 2008 Report, Department of Health and Ageing, Australian Government.
15. WA Health Performance Report, January to March 2008 Quarter, p 11 & 12.
16. At the time of writing the technical reference manual for the data shown in Figure 3 had not been released and hence this could not be confirmed absolutely.
17. The State of Our Public Hospitals, June 2008 report, Department of Health and Ageing, Australian Government, p 31.
18. The State of Our Public Hospitals, June 2008 report, Department of Health and Ageing, Australian Government, p 27.
19. The State of Our Public Hospitals, June 2008 report, Department of Health and Ageing, Australian Government, p 27
20. Victoria is chosen arbitrarily as a benchmark for an efficient public hospital system based on the reported data.
21. Report on Government Services 2008, Productivity Commission, Public Hospitals 10.20.
22. Non admitted patient care in WA public hospitals is (relative to other states and territories) disproportionately concerned with allied health services and community health.
23. Report on Government Services 2008, Productivity Commission, Public Hospitals 10.39.
24. 2008-09 WA Budget Papers, Part 7, Division 35, Minister for Health -- WA Health, p 564.
25. Report on Government Services 2008, Productivity Commission.
26. The State of Our Public Hospitals, June 2008, Department of Health and Ageing, Australian Government.
27. This is based on information published in the budget papers. It is understood that it is a contractual requirement of the two private operations that services have a lower cost per service than other public hospitals in WA.
28. Report of the WA Health Reform Committee, 2004, p 45, also known as the "Reid Report".
29. The WA Auditor General's Report of 2000 on public hospital services provided by the private sector on a competitive basis found no significant issues of concern.
30. See for example WA Health Performance Report, January to March 2008 Quarter published by the WA Department of Health as part of fulfilling recommendation 77 of the Reid Report, 2004.
31. The State of Our Public Hospitals June 2008 Report, Department of Health and Ageing, Australian Government, p 65-74.
32. www.health.act.gov.au -- Health Consumers -- Surgeon Waiting Times/Operating Sessions.
33. Elective Surgery Patient Information, Department of Health, Government of Western Australia, 2006.
34. Paterson, John. National Healthcare Reform -- The Last Picture Show, Department of Human Services, Government of Victoria, 1996, p 23.
35. A Healthy Future for Western Australians, Report of the Health Reform Committee, WA Department of Health, March 2004, p vi.
36. Paterson, John. National Healthcare Reform -- The Last Picture Show, Department of Human Services, Government of Victoria, 1996.
37. Health Expenditure Australia, 2005-06, Australian Institute of Health and Welfare, October 2007.
38. Paterson, John. National Healthcare Reform -- The Last Picture Show, Department of Human Services, Government of Victoria, 1996, p 13.
39. Neither Figure 18 nor 19 include expenditure on aged care facilities.
40. See Paterson, J. 1996


