Occasional Paper
INTRODUCTION
This submission supports the aspirations of average Australian families and argues that current planning policies, more than any other factor, restrict the capacity of first home buyers, and other less advantaged groups, from achieving a goal of home ownership. Current planning orthodoxies inflate urban land prices and discriminate against younger and poorer people seeking to achieve home ownership.
"Australia's housing can be described broadly with the following phrase: owner-occupation of detached dwellings". (1) Perth and other urbanised parts of Western Australia fit this model. At the last census 80 per cent of Perth dwellings were separate houses and a further 12 per cent are in semi-detached or terraced houses (ABS 2001 Census). Over long periods of time, and in differing economic conditions, Western Australians have continued to express a strong preference for their own home, often in a new suburb, on a relatively large block of land.
Yet for the past thirty years, urban planners and government have pursued a policy of greater density, more flats and townhouses, in higher blocks, closer to the centre of town. Instead of ordinary people acting like these elite urbanists would have it, new home buyers are forced to use up ever increasing amounts of their incomes to buy the kind of house they want. And the cause is inflated land costs produced by a scarcity of urban building land resulting from regulatory measures.
In terms of changing people's preferences (not the job of government in a free society), urban planning has resulted in ever increasing returns to existing property owners and spiralling land prices. In the process it has even failed to produce the planners' goal of increasing density.
WA has many natural advantages over other Australian states and clearly over many other places in the world. One of those advantages is space. WA has a comparative advantage in land availability. Though the state is mineral rich it can ill afford to undermine its assets by bureaucratic and regulatory measures that raise the price of housing artificially when housing land should be the cheapest in the world and contribute to providing the state a standard of living that is surpassed by few other regions in the world.
PERTH HOUSING IS TOO EXPENSIVE
... AND LAND PRICES ARE THE CAUSE
Urban land costs in Perth were relatively low until recently. In 1973 Perth land prices were lower than those in Sydney, Brisbane and Melbourne. Since 2000, the median land-to-median house price relativity in Perth has jumped from 46 per cent in the March quarter 2001, to 62 per cent today. (2) The price of residential lots in Perth has risen 77 per cent in the past year, or $115,000 to $265,000 (3), fast closing on Sydney and exceeding the average in all other Australian metropolitan areas. The president of REIWA, Mr Rob Druitt identified planning and development costs as a major factor in these price rises. "The ongoing constraints in preparing and releasing land for sale is pushing up prices and making it harder for buyers," Mr Druitt said.
Figure 1 could be from a standard introductory economics text so clearly does it show the relationship between supply and demand. Production of housing lots in Perth peaked in 2003 at 8,744 and has fallen substantially since to its current level of only 4,870 in 2006. As a result land prices have shot up like a rocket as desperate home buyers bid up the available land to gain a foothold in the market.
Figure 1: Perth Lot Supply vs. Price of Land Blocks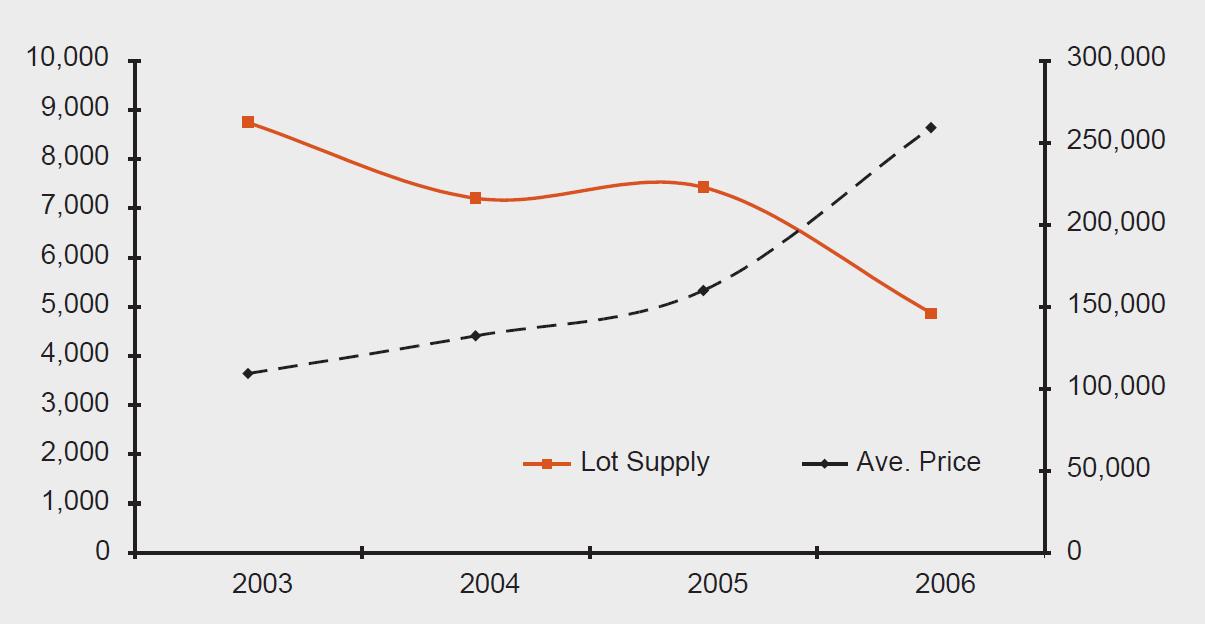 Source: 2006 UDIA State of the Land
Though different authorities have slightly different estimates of house prices, all show the steep rise in Perth prices. According to REIWA, the median house price in WA at the end of September 2006 was $450,000. This makes WA the most expensive state in Australia, out-stripping the ACT by $18,000 and NSW by $50,000. (4) Over the past year the median house price in Perth has increased by 42 per cent to $480,000, putting Perth on track to overtake Sydney as the most expensive Australian city.
The result of this phenomenal growth in housing prices is affecting first home buyers more than others. Only 1,172 first home buyers were able to purchase a home in September 2006, (5) continuing a trend of falling numbers of first home buyers being able to enter the market.
Figure 2: Perth Housing prices compared to the rest of Australia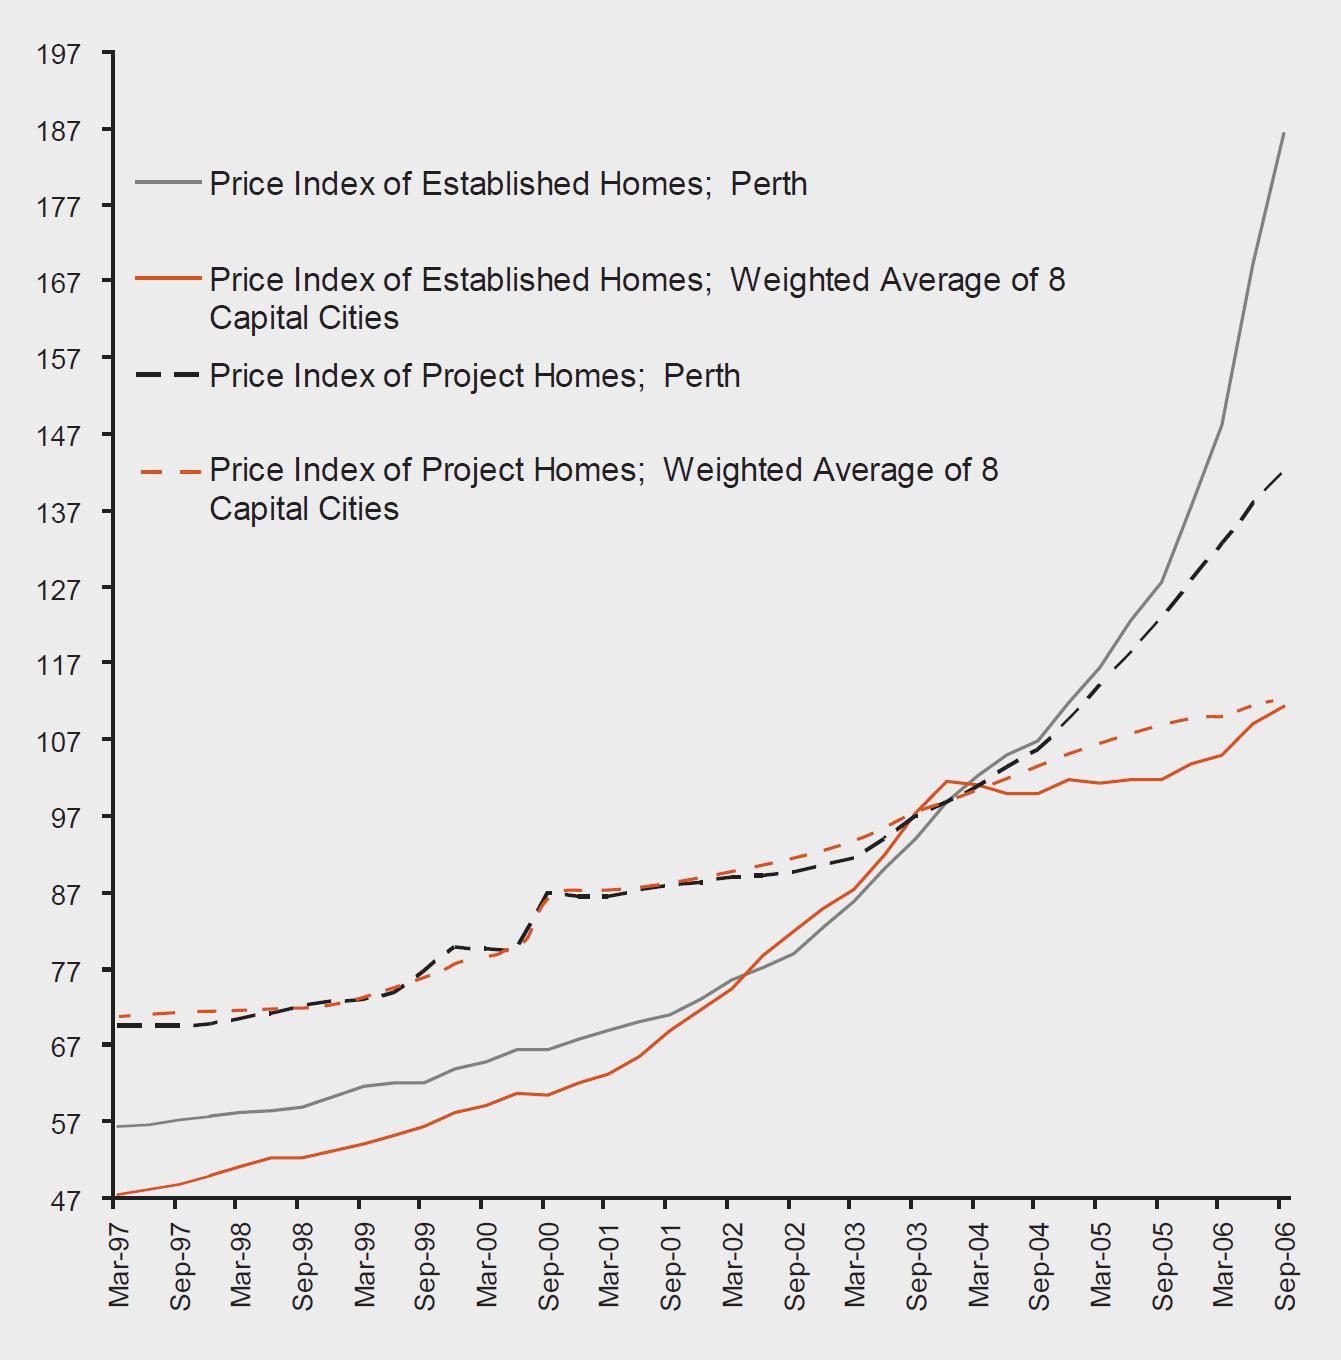 Source: ABS 6416.0
In commenting on the trend, the Productivity Commission noted that rising building material costs were not the prime mover in rising house prices and concluded that rising land prices were the culprit. (6)
A common reason put forward for high Perth (and WA generally) house prices is the resources boom causing demand pressures that will dissipate when the boom ends. Yet instead of increasing building activity to meet demand, new housing starts in WA have been stagnant for some years and actually fell in the September quarter 2006 (See Figure 3). In terms of land availability, for demand to be the cause of escalating land prices there must be a lack of supply and this is clearly the case. But the failure of a supply response is not attributable to an intrinsic lack of suitable land. There is ample land suitable for housing development surrounding Perth yet, like new housing starts, lot production (land with planning approval) far from increasing currently appears to be trending down (see Figure 4).
Figure 3: New Housing Starts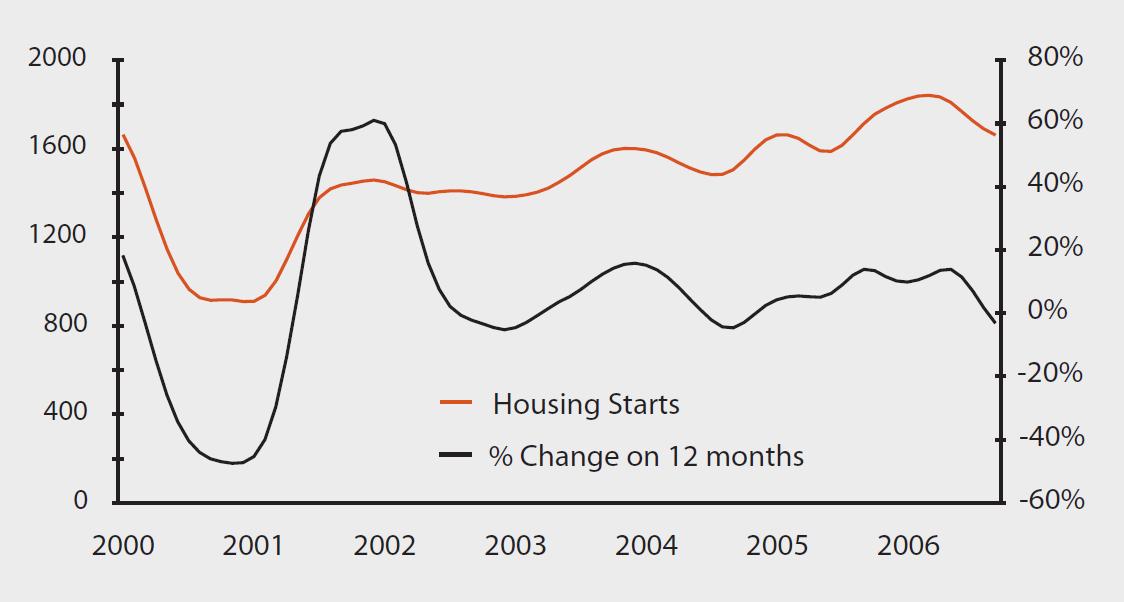 Source: ABS
Figure 4: Perth lot production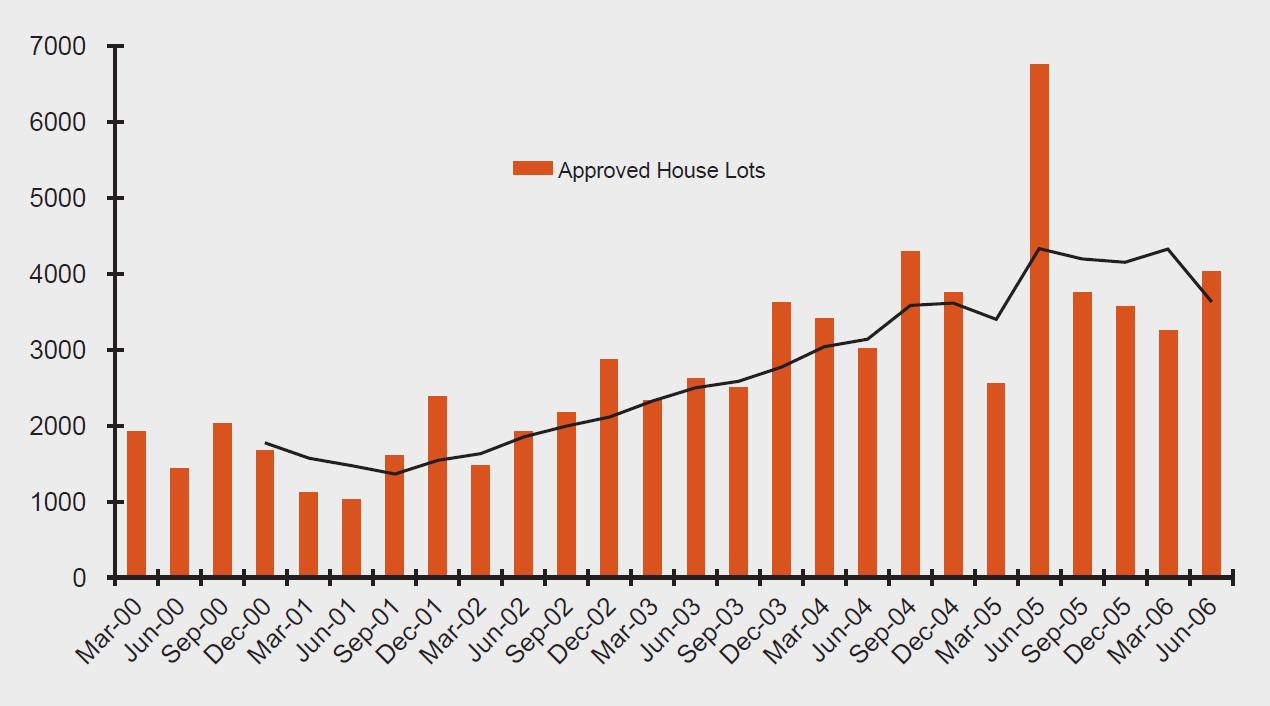 Source: REIWA
Nor can capacity constraints be blamed for the increase in new house costs or the fall in new housing starts. Building costs of new homes are up 15.7 per cent this year; this is higher than construction labour costs only up 5.0 per cent and building materials up 4.8 per cent, both in line with Perth's CPI (up 4.8 per cent) for the same period (See Figure 5). Were capacity constraints the cause of the large increases in project home costs, this would be apparent in the materials and labour prices, yet these are moving in line with the strong growth of the WA economy. Instead, the major difference between input cost prices and the final cost rises (which are, as discussed, dwarfed by the price increases) is most likely due to additional regulatory burdens being added to the new housing sector. Examples include tightening energy efficiency ratings, changes to occupational health and safety and additional government charges.
Figure 5: WA building costs and components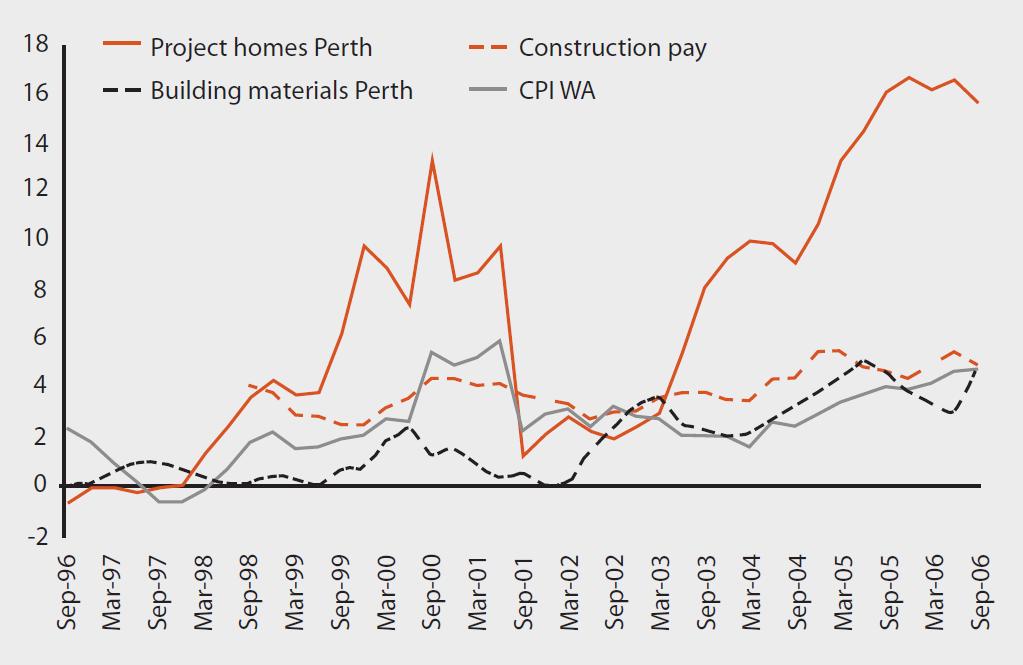 Source: ABS 6416.0, 6427.0
Furthermore as Table 1 shows, there has been a long-term mismatch in all Australian cities between land price increase and building cost increases. Housing Industry Association data shows that increases in the house component of a house and land package has broadly been in line with inflation over a thirty year period. Even in Perth, where there has been some cost breakout in the past year or so, house costs have increased eight times over 33 years compared to national CPI increases over the same period of 6.3 times. By contrast, the land price has increased by 40 times, a five fold increase over the house price increase. The latest annual land price jump in Perth of 77 per cent compared to 4.8 per cent for the CPI is more extreme than the historical data but it is of the same pattern.
Table 1: New land and house package costs
Typical new house and land prices by capital city, 1973-2006
(Standardised to a 135sqm house and a 700 sqm block)
| 1973 | 1983 | 1993 | 2006 | Price Increase Multiple 1973 to 2006 |
| Sydney |
| Land | $9,100 | $29,400 | $107,100 | $460,600 | 49.6 |
| House | $18,900 | $43,200 | $121,500 | $128,250 | 5.8 |
| Melbourne |
| Land | $6,900 | $15,800 | $49,000 | $107,000 | 14.5 |
| House | $14,000 | $35,000 | $75,000 | $112,000 | 7.0 |
| Brisbane |
| Land | $7,000 | $27,000 | $60,000 | $135,000 | 18.3 |
| House | $16,000 | $37,000 | $70,000 | $112,000 | 6.0 |
| Perth |
| Land | $6,500 | $17,300 | $80,974 | $270,000 | 40.5 |
| House | $12,000 | $28,000 | $60,000 | $109,000 | 8.1 |
| Adelaide |
| Land | $2,000 | $12,000 | $35,000 | $140,000 | 69.0 |
| House | $12,000 | $20,000 | $40,000 | $90,000 | 6.5 |
| CPI | 20.5 | 61.6 | 108.9 | 150.6 | 6.3 |
Sources: Sydney: REI of NSW;
Melbourne, Brisbane and Adelaide: UDIA;
WA: HIA.
HOUSING STRESS IS GROWING
The Australian Housing and Urban Research Institute (AHURI) defines housing stress as households with housing costs at least 30 per cent of gross household income. Extreme stress occurs when housing costs consume more than 50 per cent of total income. (7) Since 2003, median Perth house prices have more than doubled and rents have also increased markedly yet household income has grown far more modestly. As Table 2 shows, on the AHURI measure, Perth first home buyers have moved beyond housing stress in 2003 to being priced out of the market by 2006. Even using REIWA's far more generous estimates of average household income, once council rates and basic maintenance costs are added to the mortgage costs first home buyers are experiencing extreme housing stress. The low mortgage default rates and the persistence of at least a few first home buyers in entering the market demonstrate the overwhelming preference of Australians to own their own home at the expense of other expenditure. Notwithstanding this preference, there comes a point where home ownership is priced outside the realms of possibility for ordinary families and that point in the Perth housing market has been reached.
Table 2: House affordability for first home buyers
| 2003 | 2006 | 2006 (REIWA) |
| Weekly Mean Income | $1,116 | $1,322 | $1,748 |
| Weekly Median Income | $900 | $1,067 | |
| Mean income | $58,032 | $68,768 | $90,900 |
| Median income | $46,800 | $55,458 | |
| Mean After Tax | $45,273 | $52,788 | $66,690 |
| Median After Tax | $37,410 | $43,471 | |
| Median House Price | $230,200 | $450,000 | $450,000 |
| First Home Buyer House Price | $195,670 | $419,100 | $419,100 |
| First Home Buyer Mortgage @ 90% | $176,103 | $377,190 | $377,190 |
| Monthly Repayments | $1,383 | $2,961 | $2,961 |
| Annual Mortgage | $16,591 | $35,536 | $35,536 |
| Mortgage as % of Mean Income | 37% | 67% | 53% |
| Mortgage as % of Median Income | 44% | 82% | |
Sources: REIWA, ABS 6523.0, National Australia Bank Standard Variable Rate, HIA/CBA
WA and other governments are in danger of creating a class system—whereas wealthy people can help their own children get a start in the housing market, children of poorer parents become marginalized—unlike in the pre-planning restraint era, it is increasingly difficult for them to find the means themselves to step onto the real ladder of opportunity. This illustrates how regulatory measures can have unintended bad consequences. Goals that might have some broad support in the abstract, for example to create higher density cities, come up against people's preferences and the forced densification leads to higher prices and less development that infects the whole of the community.
UNAFFORDABILITY: PERTH MAKES THE GLOBAL TOP 10
Another measure of housing affordability is the multiple of median housing prices to median income. International research on these multiples has concluded that ratios below 3 are rated as affordable and above 5.1 as severely unaffordable.
Given the explosion of median house prices since 2005 to the current level of $480,000, (8) Perth's current housing affordability rating has leapt to 8.7, making Perth the least affordable housing market in Australia and the seventh least affordable market on the planet (see Table 3).
Table 3: Top 10 most unaffordable housing markets
| Rank | Housing Market | Median Multiple |
| 1 | US | Los Angeles | 11.2 |
| 2 | US | San Diego | 10.8 |
| 3 | US | Honolulu | 10.6 |
| 4 | US | Ventura County (Greater LA) | 9.6 |
| 5 | US | San Francisco | 9.3 |
| 6 | US | Miami | 8.8 |
| 7 | Aus | Perth | 8.7 |
| 8 | Aus | Sydney | 8.5 |
| 9 | US | New York | 7.9 |
| 10 | US | San Jose | 7.4 |
Source: Demographia.com 3rd qtr 2005, Perth calculation 3rd Qtr 2006.
The research institute Demographia notes that all the cities in the least-affordable category have stringent planning and building codes which limit the availability of new housing and increase building costs.
YOUNG FAMILIES ARE PARTICULARLY HARD HIT
Perth's outright home ownership in 1996 was 37 per cent with 31.5 per cent buying their own home. Total owned occupied housing rate of 68.5 per cent is not much different from the 71per cent of a decade before. (9) By 2001 the rate had inched back up to 70 per cent home ownership. (10) However these gross statistics mask some significant changes in the age profile of homeowners.
The rates of home ownership by younger people are falling as they are priced out of the market. Yates, in a study of the causes of falling home ownership in this age group, found:
- Less than 25 per cent of these declines could be attributed to the changing socioeconomic composition of households (the endowment effect) in each city.
- The remaining 75 per cent (the residual effect) is attributable to the changes in housing market constraints, or to changes in any other factors that affect tenure choice (such as changes in preferences).
- The results obtained suggest that the housing market constraints are the dominant explanation for declines in home ownership rates.
- Within the 25-44 year old age group under consideration, home ownership rates generally declined most for households with children, yet these are households for whom many of the social benefits attributed to home ownership are perceived to be the most pronounced.
- Declines in home ownership have been greater in metropolitan regions, where the economic (real capital) gains from home ownership have been higher and less in non-metropolitan regions where the economic gains have been lower. (12)
While Yates did not enquire into the sources of housing market constraints, her conclusion that constraints were the cause highlights the scope of the impact of creating market conditions that ordinary Western Australian families find it impossible to get a foothold on the ladder of home ownership.
Yates looked forward to the outcome if these younger households are permanently excluded from home ownership, and concluded the rent assistance demands they make on public expenditure are likely to re-emerge when they reach retirement age. Likewise, the support services they may need are likely to differ depending on whether they are, or are not, in their own home. If they live in areas where housing is low cost and, because of this, have less access to employment opportunities, the rent assistance demands they make on public expenditure are likely to continue until they reach retirement age. (13)
We do not necessarily believe that all should own their own home (and there are very good reasons, including the need for a stock of dwellings for those starting out in adult life and for the increasing number of people who are transient in a particular city). What does seem offensive though are policies that result in artificially high prices that make such choices unaffordable. Aside from the utilitarian motive that owning a home provides people with a savings cushion that reduces their future call on others, home ownership gives citizens a property stake in the community, a stake that would almost certainly enhance their feeling of shared community, matters that enhance the lifestyle satisfaction of all.
One of the reasons young families suffer disproportionately from excessive housing costs is that they are often at the stage in the lifecycle where they rely on one income as one parent stays at home to raise young children. Most Australian women return to the workforce once their children are in school however this is often part-time work and occurs when the costs of raising children are at their peak. It is therefore unsurprising that many couples delay having children until they can get settled in their own home. With WA median prices at $450,000, increasing numbers of couples will either reduce their number of children or remain in the also overheated rental market.
Table 4: Home ownership, Perth (11)
| Age | 1996 (per cent) | Change from 1986 |
| 15-24 | 24.6 | -5.6 |
| 25-44 | 65.1 | -4.4 |
| 45-64 | 80.2 | 4 |
| 65+ | 73.0 | -3.2 |
EXPENSIVE HOUSING HURTS THE ECONOMY
Edward Glaeser of Harvard University, blames excessive regulation for slowing construction to the point where demand has outstripped supply, fuelling a run-up in home prices. The danger, says Dr. Glaeser, is such places have priced out today's highly skilled "knowledge workers", forcing them to live in a more affordable locale where their contribution to the economy might not be as great. "These are places where only the elite can live", Dr. Glaeser says. (14)
Already this is a common theme in blogs as people trying to buy a house on ordinary incomes find this has become impossible in Perth. (15) Many professionals and trades people vital to the growth and operation of an economy such as teachers, nurses, and chefs can no longer afford to buy housing. Over time these people will migrate to other areas and States in pursuit of the Australian dream but WA will endure chronic labour shortages.
A QUARTER ACRE BLOCK IS A FOND MEMORY
The modern city is more dispersed because it can be. Jobs are less concentrated, shopping centres more diversified, the number of trips to the centre has fallen from over 50 per cent to 10 per cent. Planners must adapt to the city not try to force people to live in ways they do not prefer. People want to live in their own space and Perth and WA generally is ideally positioned to allow this
There are common misconceptions that Perth's low population density is both exceptional for cities of her size and an unwanted blight. Yet compared to some European cities of similar size such as Lyons, Marseilles and Bordeaux, Perth is not all that dispersed. It is comparable with Boston, Baltimore and virtually every other 800,000 to 1.5 million sized city in the US and Canada. WA has a comparative advantage in land availability. Though the state is mineral rich it can ill afford to undermine its assets by bureaucratic and ill considered political moves that raise the price of housing artificially when housing land should be the cheapest in the world and contribute to making the state a standard of living that is surpassed by few other jurisdictions anywhere in the world.
Perth's average block sizes are declining from around 800 square metres (0.2 of an acre) 20 years ago, and comparable in size to the suburban areas of many US cities, to around 550 square metres today. (16)
Figure 6: Perth Lot Sizes and Price (17)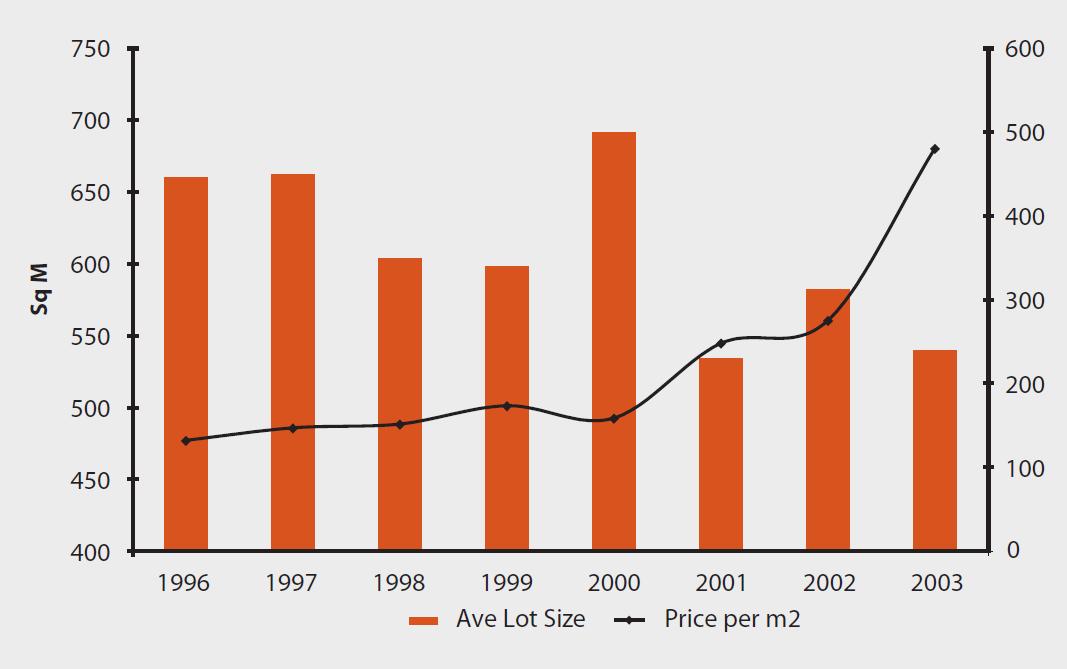
The reduction in house block size is unlikely to be driven by consumer preference. New house sizes have been increasing as block size shrinks, leading to the phenomena disparagingly called McMansions. Instead, the reduction in house block size is much more likely related to the exorbitant cost of development land. Families buying these new house and land packages just can't afford the size blocks their parents did and the continuing preference for more housing space per person is leading to larger houses being placed on smaller blocks. Recent comment from Perth developers has noted house sizes are now falling as people decide they can live without a separate dining room or the fourth bedroom. Again, this is unlikely to be an expression of unbounded consumer preference, instead home builders having already shrunk their block size by 30 per cent as land prices have exploded, are now lowering their expectations of what kind of house they can build and still be able to afford it.
As a recent UK report into planning notes densification comes at a cost, the cost of frustrating the clear preference of most people to live in detached housing rather than flats or other housing options. Furthermore, "densification can also make the best use of available land, but there are limits to how far this can go. Although in some urban areas it is possible to build at very high densities, this may be less acceptable elsewhere. The savings of land which come from building at 50, rather than 40 dwellings per hectare are smaller than those from building at 30 rather than 20 per hectare." (18)
In WA, like the rest of Australia, people have over long periods of time expressed a clear preference for lower density living. The Australian lifestyle has also been a key draw card for the large waves of immigration by people who have achieved their dreams by building houses that reflect their heritage in suburbs in all major cities. There are in fact some 1.3 million Brits resident in Australia and according to research by the Institute for Policy Research (19) a major reason for this outflow is the exhorbitant price of houses in the UK. This attraction is likely to be severely diminished unless policies are changed.
THE COSTS OF NEW HOUSING
REIWA estimate the current price in Perth for an average block of 550 sq m at $265,000. (20) There are two major causes of housing development land costing so much more than the price of bare land. The first is that development costs add significantly to the undeveloped land price. Some of these costs, such as direct utilities connections and developer margin are properly borne by the buyers of new housing, the utilities add about $36,520 (see Table 5) with about $40,500 in design, building road preparations and margin. However there are a plethora of other charges such as offsets for open space, school provision, public transport provision etc. which are lumped on residential developers and therefore passed onto the buyer; these add a further $32,000 to each house block. On average, a total $109,020 per block is charged in developer costs and government charges.
Table 5: Land allotment costing
| Nature of cost | Cost per allotment |
Civil works construction costs including:
Establishment & Disestablishment
Sedimentation Control Works
Allotment filling
Road Formation works
Roads, pavements & gutters
Hot-mix seal coat
Stormwater drainage works
Sewer reticulation
Water reticulation
Common Service Trenching
ETSA/Telstra conduits materials
Survey Certificate
CITB levy | $30,415 |
| Sewer | $2,495 |
| Water Supply | $500 |
| Survey & Engineering | $3,000 |
| Planning, registration, title fees | $110 |
| TOTAL | $36,520 |
Source: Figures extracted from a 70 Allotment Stage for a development within the City of Onkaparinga with sales starting in mid 2006.
However, in Perth, the largest impost on buyers of house and land packages is the undeveloped cost of the land of $156,000. At $156,000 for 550 sq m development land is being sold for $2,836,000 per hectare. This is clearly absurd for a resource that is naturally abundant but restricted in supply by planning laws. A more reasonable figure for undeveloped land would be $60,000 per hectare, $3,300 per block which would still value the land at more than five times the most expensive agricultural land and provide handsome returns to farmers selling up. At $60,000 per hectare this provides a substantial profit to the selling landholder if it is compared to the average price of $2,000 per hectare estimated by ABARE for agricultural land in the high rainfall wheat sheep areas in the south west of Western Australia.
In a recent enquiry into first home ownership the Productivity Commission noted the slow supply of housing will cause large price rises in land in the presence of increased demand. (21) It is likely therefore that some of the current spike in price will have been caused by a short-term supply demand mismatch as a result of the booming WA economy. However, as Table 1 shows, housing prices across Australia and including Perth, have shown marked long run increases above inflation. Therefore, even after making allowance for current upsurge in price inflation (as land holders with development approval are able to obtain extraordinary returns), underlying undeveloped housing land is massively overpriced because of long-run government rationing through the planning process.
Moreover, restraints on land availability are suppressing the normal market reaction by not allowing increased stock to be made available to respond to the soaring price rise caused by lack of supply.
Building approvals are shown in Figure 7 below. Remarkably, given the booming economy of Perth, building approvals have only trended upwards marginally from 1436 in September 2001 to 1675 in September 2006 (16.7 per cent). The cost data presented above strongly suggests that labour and material shortages are not the cause of the relatively sluggish increases in building approvals. Instead, builders have insufficient land on which to seek approval.
Figure 7: WA Building Approvals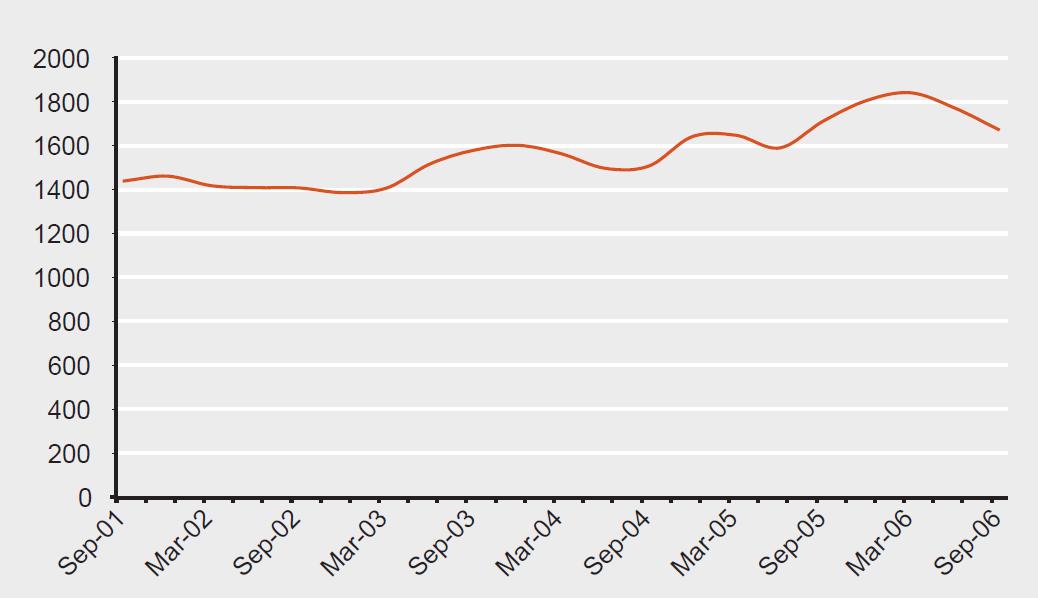 Source: ABS
Land preparation costs, like house building costs have been kept competitively priced by competitive forces. The following is typical of the components of costs necessary to have land readied for building.
If land was a reasonable price and governments did not require home buyers to pay for all the additional costs (such as provision of open space, regional roads, schools etc.) that previous generations of home buyers received as part of general government provision financed through the general tax base, the total cost of a new home would drop from $379,000 (22) to $195,500. The difference of over $180,000 costs the home buyer an additional $1,546 per month at current interest rates and brings the total mortgage (assuming 90 per cent borrowed) to $666 a week. The most recent ABS household income numbers show WA has a median household income of $889 per week. (23) This implies a new home owner with an average income spends 75 per cent of their household income on housing, in effect proving the impossibility of ordinary income earners to buy a house and land package in Perth. If the raft of government policies penalising home owners were removed the proportion of income paid by average income earners would fall to 34 per cent, still above what the Australian Government's research institute thinks is appropriate, but not an impossible dream for ordinary families.
Figure 8: Perth new housing under different regulatory regimes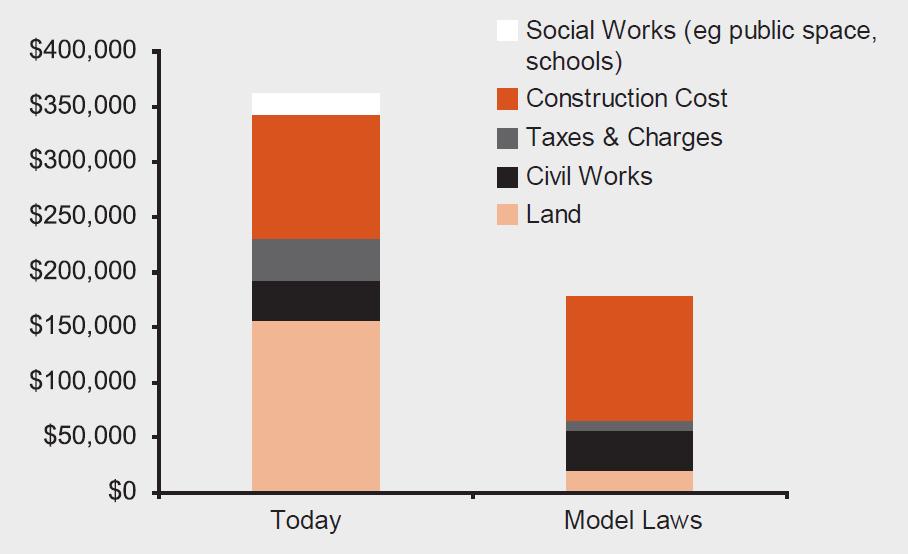
PERTH AND HOUSTON: SISTER CITIES
Perth is sister city to Houston, the largest city in Texas. Texas and Western Australia have much in common in terms of their mineral and petroleum wealth and frontier nature. Texas has a larger and faster growing population than WA and forty times the population density of WA. Similarly, the greater Houston area has over three times the population of greater Perth. However the cities share similar population density and broadly similar home ownership levels.
As Table 6 shows, even on 2005 data (the latest available for all measures) Perth's median housing price is over 2½ times that of Houston. All else being equal, housing prices would be expected to be higher in Houston: the city has higher incomes and the US has lower interest rates, making mortgages cheaper.
Table 6: Comparison of Perth and Houston
| Texas | WA |
| State population (2000) | 22,471,549 | 1,978,079 |
| Households (‘000) | 7,393 | 695 |
| State GDP (bn) | $989.4 | $65.2 |
| GDP per capita | $44,031 | $32,491 |
| Area (sq km) | 696,241 | 2,527,633 |
| Population density per sq km | 32.30 | 0.8 |
|
| Houston | Perth |
| Population 2005 | 3.8m | 1.2m |
| Land area, sq km | 3.355 | 964 |
| Persons per sq km | 1,132 | 1,244 |
| Median value occupied housing 2005 | $123,400 | $331,100 |
| Median household income 2005 | $46,705 | $55,458 |
| Home ownership 2005 | 62.9% | 68.5% |
| Median monthly housing costs | $601 | $2,080 |
| Mortgage costs as per cent household income | 15% | 45% |
| 2005 house price as a multiple of income | 2.6 | 6.0 |
Source: ABS, US Census Bureau, all values in local currency
On this basis Houston ranks as one of the more affordable housing markets in the developed world. (24) By contrast, using 2005 data Perth has a ratio of 6.0, placing this city in the severely unaffordable category. (As discussed above, Perth's ratio is now 8.7). Similarly, using the housing costs as a percentage of household income measure vividly demonstrates the affordability of Houston housing at only 15% going to mortgage costs with Perth homebuyers hefting an average 45 per cent of their income to pay the mortgage.
Building costs, housing size and other demand factors are not the cause of Perth housing being so much more expensive than Houston, (25) instead the major difference is planning controls, with Houston having no city development boundary and a pro-development city administration. According to the Wall Street Journal Houston "has some of the least-restrictive land-use and construction rules in the nation. Those factors help supply to keep pace with demand and keep prices within reach of a broad range of potential buyers." (26)
If Perth had a housing multiple the same as her sister city Houston, median house prices would decline to $181,700, a fall of 62 per cent and housing costs would fall to a very manageable 25 per cent of median household income allowing more first home buyers, young families and other average income households to purchase their own home.
Tellingly, whether the optimal house and land package is calculated from the ground up so to speak of actual costs or implied by applying a reasonable multiple to income to determine a fair price, the result is quite similar: $195,500 from a cost basis and $181,700 using a multiple. Either methodology results in a far more affordable price than the current $379,000 for house and land packages or $480,000 for an established house.
SPRAWL IS NOT A DIRTY WORD
Within current planning discourses a number of orthodoxies reign. Together these orthodoxies seek to build a comprehensive case in favour of urban infill and increased density. However, the majority of urban Western Australians, like their counterparts in other Australian cities, choose to live in suburbia. Moreover, for many people, the great Australian dream is still to build their own home, to their own specifications, in a new suburb, surrounded by families doing the same thing.
Never mind rising sea levels and galloping desertification. Never mind that suburbia guzzles land, wastes energy, pollutes air, generates traffic, disperses community, makes services expensive and public transport impossible. Or that in 20 years, when the dominant household is the single person, all these effects will intensify. (27)
In the quote above Elizabeth Farrelly of the Sydney Morning Herald manages to compress into a short diatribe many of the elitist criticisms of suburbia. All of which are either totally without foundation or not applicable to low density cities such as those found in Australia. As for suburbia guzzling land, presumably from that other evil water waster, agriculture, it is not as if land is scarce in Australia. Similarly there is a strong relationship between urban sprawl and pollution—but not the one the new urbanists suggest. Air pollution tends to increase with population density. (28)
INFRASTRUCTURE UTILISATION ORTHODOXY
This orthodoxy argues increasing density in established areas better uses the existing infrastructure—roads, sewerage, public transport etc. However, this line of thinking, often pushed by urban planners and ministries of planning, is frequently stymied by the power of existing homeowners in established suburbs who will not accept increased density in their area, arguing it will destroy the character of the area. The result is the infill plans of the planners are not fulfilled and housing pressures remain.
However there is a false assumption and a huge degree of paternalism underlying the infrastructure utilisation orthodoxy. The false assumption is that increasing density in the centre will result in better utilisation of services and utilities. In some cases such as inner city roads these are at capacity already, in others such as sewers, inner city municipalities have persistently skimped on maintenance and upgrades because as their population densities declined it has been cost effective to let those services slowly decay. In some cases the costs of upgrading them for higher density is well beyond the costs of new sewers on the urban fringe. As an example of this, high speed telecommunications needs optic fibre to the home, easily and cheaply added to new developments but very expensively to existing housing.
The paternalism arises in a number of ways but the major one is public transport. Planners believe, for a variety of reasons that more people should take public transport, particularly to commute to work in the CBD. However, only 15 per cent of total employment is in the central business districts (29) and this figure continues to fall. Public transport systems designed around getting people to work no longer fit the patterns of work with more people working across town from where they live and the massive increase in part-time employment changing the traditional morning and evening peak hours to more frequent transport throughout a longer daily period. As a result in 2001 only 8.1 per cent of work trips in Perth were by public transport and public transport's market share is declining. (30)
Even assuming the infrastructure utilisation theory is right, which is not what the data shows, however for the sake of the argument assume infill is cheaper to provide services to than greenfields development. The clear response in that circumstance is to fully and properly cost the unavoidable infrastructure costs (not the planners wish list costs) and add the necessary costs to the development. Open and transparent costs allow potential buyers to effectively weigh up whether they are prepared to pay those costs.
ENVIRONMENTAL ORTHODOXY
This orthodoxy argues households with large houses on the periphery use more energy than compact houses near the centre. More car use causes higher greenhouse gases. This is a bad thing. Solutions include infilling the existing areas and if necessary only build new suburbs out along heavy rail, enforce stringent environmental standards on new housing and require developers (and therefore new home buyers) to pay hefty amounts for open space preservation and environmental works.
Again this is dictating the values of a small urban group on the vast majority of people who want their own home, on its own block, with a garden and a three car garage. No amount of money poured into public transport will make most people use it. Even if free it is not convenient for people who want to go across town, who have the weekly food shopping, who have babies and young children with them.
In 1995 private road vehicles represented about 93 per cent of city passenger transport. Urban public transport is a minor component of city transport and has been for many years. As Figure 10 shows, the average number of journeys per year by Perth residents is about 30, or 15 round trips, and has been around that level since 1991. That's only slightly more than one return journey a month for the average person.
Figure 9: Urban passenger transport trips (Australia)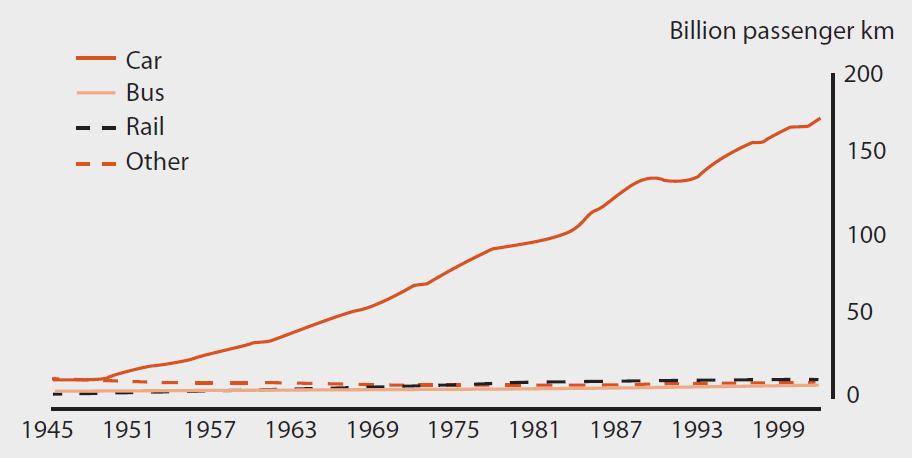 Source: Bureau of Transport Economics, Working Paper 38
Figure 10: Annual public transport journeys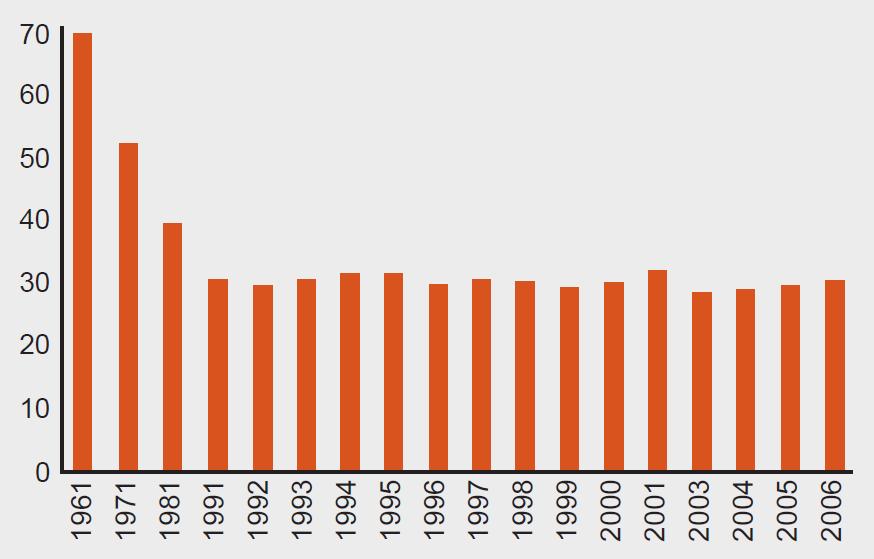 Source: Western Australia Department of Transport, Passenger Transport Annual Reports, various years.
Over the past thirty years the car has proven the preferred mode of transport except in extremely dense cities such as Hong Kong and Tokyo. Perth can never emulate the high rise density of Hong Kong and therefore can never match the densities needed to run a mass transit system that people actually prefer to use. It is unrealistic for urban planners to attempt to instil an alien mass transit ethic on fundamentally suburban communities, the result will be higher public transport subsidies not higher usage.
MISMATCH ORTHODOXY
As household size declines housing size should also decline and people who do not adjust their living space in light of the number of people in the household are underutilising the housing stock. (31)
Household size has been declining for over 40 years yet until recently house size has been growing as all household sizes exercise their preference for larger per person living spaces. The notion that "empty nesters", child free couples and singles somehow all prefer to live in new high rise inner urban apartment blocks has not been borne out by the evidence. (32) The occupants of the new apartment blocks are overwhelmingly young people, often students and recent graduates moving out of their childhood home. Relatively few families with children or people over forty are populating the revitalised inner city.
The continuing decline in the size of households in Western Australia is affecting housing demand but not in the way those who think there is an appropriate house size per person would advocate. Lone person households increased from 24.9 per cent of all households in June 1999 to 26.8 per cent in June 2004. In comparison, in the 1991 Census, 19.6 per cent of Western Australian households consisted of only one person. Between 1999 and 2004, the total number of households in the state increased from 707,574 to 772,062, with declining household size accounting for 15,109 households or 23.4 per cent of the increase. (33) Perth residents are breaking into smaller family units but the trend to larger houses is outweighing the lower numbers of people in each one.
THE KITCHEN SINK ORTHODOXIES
Suburban sprawl encourages car use at the expense of walking thereby reducing the exercise of residents and adding to the obesity epidemic. Home gardens in suburbia use too much water which is in short supply due to the drought/climate change. Sprawl uses up productive farmland which will lead to an inability of the cities to support themselves due to lack of food supply. Suburbia is a cultural wasteland characterised by isolated and compartmentalised households. By contrast, inner urban areas are awash with cultural vibrancy and dense networks leading to high stocks of social capital.
This list is almost endless. It would no doubt be possible to create a game where the compère lists a random social, environmental or other public policy problem and contestants come up with how it is caused by urban sprawl.
Each of these kitchen sink assertions need to be empirically tested, for example recent water usage figures in Melbourne show some of the most established inner suburbs are much higher water users than gardens at the periphery. Similarly recent US research found higher stocks of social interaction and social capital in outer suburban areas than the inner city, (34) putting paid to the assertion the suburbs are full of desperate housewives living lives of misery and despair.
CONCLUSION
That Perth's housing market is overheated is beyond doubt. But for government to throw up its collective hands and assume nothing can be done until the mining boom ends is both an abrogation of responsibility and the wrong conclusion to draw from the data. The overwhelming reason housing is too expensive for first home buyers and ordinary middle income families is because land is massively overpriced. This can be fixed relatively easily; by easing the planning controls and other cost imposts that restrict the supply of land for housing.
Despite thirty years of a planning orthodoxy designed to increase density, homebuyers have consistently frustrated the designs of the urban elite to force them into high rise apartments. Overwhelmingly families, particularly as they begin to have children, want to live in low density, residential neighbourhoods. Market forces if left to their own devices will ensure these are serviced by convenient shopping centres. The great Australian dream remains a detached house. When denied this choice or government regulations overprice it, people opt for a reduced block size. Now, an ever growing number are not able to buy at all and remain in the rental market.
It is not the right of government to dictate to the people how they should live. It is their duty to remove blockages to people's pursuit of their own versions of happiness not to create barriers to this. And while a case can be made for governments to dictate some things where there are externalities present (e.g. infrastructure costs not born by individuals), this is not an important factor in new developments in Western Australia. Indeed the costs of the infrastructure is greater in the older inner city areas because it needs to be replaced and this involves far greater expenditure than in green field sites where more modern piping and other products can be easily incorporated.
ENDNOTES
1. David Clark Batten, "The Mismatch Argument: The Construction of a Housing Orthodoxy in Australia" Urban Studies 36, no. 1 (1999).
2. Reiwa.com.au, Land Prices, Building Costs Skyrocket (Real Estate in WA, 15 November 2006 [cited 19 November 2006]).
3. Ibid. (cited).
4. Shane Wright, "WA Homes Nation's Hottest Property", The West Australian, 10 November 2006.
5. Australian Bureau of Statistics, "Housing Finance, Australia, Sep 2006", (Canberra: ABS, 2006).
6. Productivity Commission, "First Home Ownership", (Melbourne: The Productivity Commission, 2004).
7. Judith Yates, "Housing Implications of Social, Spatial and Structural Change", (Sydney: Australian Housing and Urban Research Institute, 2002).
8. Reiwa.com.au, Perth vs Melbourne for Highest Tax on First Homebuyers (Real Estate in WA, 20 October 2006 [cited 19 November 2006]).
9. Yates, "Housing Implications of Social, Spatial and Structural Change".
10. Australian Bureau of Statistics, "Census 2001: Perth", (ABS, 2001).
11. Yates, "Housing Implications of Social, Spatial and Structural Change".
12. Ibid.
13. Ibid.
14. Thaddeus Herrick, "Houston Missed the Real Estate Boom of East and West Coasts, but Now It's Payback Time", Wall Street Journal, 7 November 2006.
15. See for example http://blogs.news.com.au/perthnow/fromlisaslips/index.php/perthnow/comments/the_real_estate_market_is_a_disgrace/ and http://www.hismethod.com/2006/11/04/crazy-land/ and http://mgio.spaces.live.com/Blog/cns!3FB2AC53354F3446!1368.entry
16. Reiwa.com.au, Bigger Houses on Smaller Blocks Create New Issues (Real Estate in WA, 6 November 2006 [cited 19 November 2006).
17. David Poole, "The 2006 Udia State of the Land", (Epping, NSW: Urban Development Institute of Australia, 2006).
18. Kate Barker, "Barker Review of Land Use Planning", (Norwich: HMSO Treasury, 2006).
19. http://www.ippr.org.uk/pressreleases/?id=2479
20. Reiwa.com.au, Land Prices, Building Costs Skyrocket ([cited).
21. Productivity Commission, "First Home Ownership".
22. See Table 1, land $270,000 + house $109,000 = $379,000, source HIA
23. Australian Bureau of Statistics, "Household Income and Income Distribution, Australia, 2003–04", (Canberra: ABS, 2005).
24. Wendell Cox and Hugh Pavletich, "2nd Annual Demographia International Housing Survey: 2006", (Belleville, IL: 2006).
25. Richard J. Wood, The Tragedy of Planning (Toowoomba, 2006).
26. Herrick, "Houston Missed the Real Estate Boom of East and West Coasts, but Now It's Payback Time".
27. Elizabeth Farrelly, "More Reasons Than Ever to Fight for Human Cities", The Sydney Morning Herald, May 17 2006.
28. Demographia.com "Mythical Underpinnings: The New Urbanism, Smart Growth and the Crusade Against Urban Sprawl"
29. Wood, The Tragedy of Planning.
30. Wendell Cox, "Urban Transport Fact Book", (Belleville, IL: The Public Purpose, 2003).
31. Batten, "The Mismatch Argument: The Construction of a Housing Orthodoxy in Australia ".
32. Gary V. Engelhardt, "Housing Trends among Baby Boomers", (Washington, D.C.: Research Institute for Housing America, 2006).
33. ABS December Quarter 2004 issue of Western Australian Statistical Indicators, ABS Catalogue Number 1367.5
34. Jan Brueckner and Ann G. Largey, "Social Interaction and Urban Sprawl", in University of California-Irvine, Department of Economics - Working Papers (Irvine: 2006).
BIBLIOGRAPHY
Australian Bureau of Statistics. "Census 2001: Perth". ABS, 2001.
———. "Household Income and Income Distribution, Australia, 2003–04". Canberra: ABS, 2005.
———. "Housing Finance, Australia, Sep 2006". Canberra: ABS, 2006.
Barker, Kate. "Barker Review of Land Use Planning". Norwich: HMSO Treasury, 2006.
Batten, David Clark. "The Mismatch Argument: The Construction of a Housing Orthodoxy in Australia" Urban Studies 36, no. 1 (1999): 137-51.
Brueckner, Jan, and Ann G. Largey. "Social Interaction and Urban Sprawl". In University of California-Irvine, Department of Economics - Working Papers. Irvine, 2006.
Cox, Wendell. "Urban Transport Fact Book". Belleville, IL: The Public Purpose, 2003.
Cox, Wendell, and Hugh Pavletich. "2nd Annual Demographia International Housing Survey: 2006". Belleville, IL, 2006.
Engelhardt, Gary V. "Housing Trends among Baby Boomers". Washington, D.C.: Research Institute for Housing America, 2006.
Farrelly, Elizabeth. "More Reasons Than Ever to Fight for Human Cities". The Sydney Morning Herald, May 17 2006.
Herrick, Thaddeus. "Houston Missed the Real Estate Boom of East and West Coasts, but Now It's Payback Time". Wall Street Journal, 7 November 2006.
Wood, Richard J. The Tragedy of Planning. Melbourne: Institute of Public Affairs, 2006.
Poole, David. "The 2006 Udia State of the Land". Epping, NSW: Urban Development Institute of Australia, 2006.
Productivity Commission. "First Home Ownership". Melbourne: The Productivity Commission, 2004.
Reiwa.com.au. Bigger Houses on Smaller Blocks Create New Issues Real Estate in WA, 6 November 2006 [cited 19 November 2006].
———. Land Prices, Building Costs Skyrocket Real Estate in WA, 15 November 2006 [cited 19 November 2006].
———. Perth vs Melbourne for Highest Tax on First Homebuyers Real Estate in WA, 20 October 2006 2006 [cited 19 November 2006].
Wright, Shane. "WA Homes Nation's Hottest Property". The West Australian, 10 November 2006.
Yates, Judith. "Housing Implications of Social, Spatial and Structural Change". Sydney: Australian Housing and Urban Research Institute, 2002.


 Source: 2006 UDIA State of the Land
 Source: ABS 6416.0
 Source: ABS
 Source: REIWA
 Source: ABS 6416.0, 6427.0
 Source: ABS
 Source: Bureau of Transport Economics, Working Paper 38
 Source: Western Australia Department of Transport, Passenger Transport Annual Reports, various years.