Backgrounder
INTRODUCTION
On 1 July 2000, the Goods and Services Tax (or GST) was introduced as the central plank of Australia's A New Tax System (ANTS).
This not only represented the largest change to the Australian tax system since the Commonwealth Government began levying personal income tax in 1942, but also the largest change to State-Federal fiscal relations -- again since the introduction of Commonwealth income tax.
The GST did not happen in isolation; it coincided with rapid economic growth fuelled by decades of reform. Together these should have generated "reform bonuses for the States".
If anything, the prevailing view is that the States have once again been diddled by the GST and Commonwealth. That is, they have been left with too little money to undertake their growing tasks.
There is also the issue of reform. All governments -- State and Federal -- understand the need to undertake a new wave of reform, and that this necessarily requires leadership from the States. Indeed the States, led by Victoria, presented an ambitious, albeit sketchy, programme of reform to the February 2006 Council of Australian Governments (COAG) meeting. (1) They claimed that, if undertaken, it "would add half a percentage point to GDP each year" and "bring fiscal dividends of between $8 billion and $13 billion a year over the next 10 years" -- which is large by any standard.
However, rather than make a commitment to reform, the States have once again demanded more money -- $10 billion over ten years -- from the Commonwealth, claiming that they lack the money to undertake the necessary changes and will, as a result of their inferior tax base, not receive a fair share of the tax gain. (2)
This gives rise to the question: what happened to GST and the reform bonus? The proceeds from the GST were given to the States specifically to allow them to gain a greater share of economic growth to fund better service delivery and undertake reform. Moreover, the States have repeatedly justified maintaining high tax rates or failing to eliminate taxes on grounds that they need to meet infrastructure demands and undertake reform of services.
Then there is the on-going question of the effectiveness of the federal system. Fifty years of centralism and federal paternalism have had a detrimental impact on public perceptions about the usefulness of our federal system, and in particular, the role of the States. A survey conducted last year by Griffith and Charles Sturt universities found that three-quarters of the respondents supported systemic change to the federal system, with just less than half supporting the elimination of the States. Only 12.5 per cent supported the current structure. (3)
As Ken Wiltshire of the University of Queensland and one of Australia's leading federalism scholars summarised it: "Faced with the image of overlap and duplication and constant squabbling between commonwealth and states, the average citizen quickly jumps to the conclusion that abolition of one tier is the answer and will save money and acrimony". (4)
While the Commonwealth has done much to undermine the standing of the States by usurping taxing and spending power, in the end, the States are responsible for their own poor reputation and for fixing it.
If the States fail to improve their standing with the public, which must include leadership in reform of their own areas of responsibility, the federal system is likely to remain in name only and the States to become little more than administrative units of Canberra.
REVENUE WINDFALL
Since the introduction of the GST, the States and Territories have experienced phenomenal, indeed record, growth in revenue -- far in excess of the rate expected at the time the GST was introduced.
At the time of the introduction of the GST, the States forecast total revenue growth over the 2000/01 to 2004/05 period of just 3.2 per cent per year. (5) Thanks to the GST, grant income was expected to grow by 10.7 per cent per year and own-tax revenue was predicted to decline over the period as a result of the loss of taxes resulting from the GST deal. The net result was that the States did not expect to be a net beneficiary of the GST until 2006-07.
As it turns out, this was unduly pessimistic and substantially underestimated the revenue-generating capacity of the GST, the States' own taxes and other revenue sources.
During the first five years of the decade, State sector revenue from all sources grew by an average annual rate of 8.0 per cent per year. This was 4.8 percentage points above forecast, and represented approximately real per capita growth of over 4 per cent per year.
The net result was that the States received $70 billion or about 14 per cent more revenue than they expected over the first five years of the decade (see Table 1). That is, when the State sector's actual revenue is compared with what they predicted (6) when the GST was first implemented, the sector was financially better-off by about $70 billion. (See Graph 1 for pattern of revenue windfall growth over time.)
State Sector: Forecasted vs. Actual Revenue and Outlays
Graph 1: Total Revenue
Table 1: State Sector: Windfall Revenue 2000/01-2004/05
| Total Revenue Windfall $ billion | As share of Total Expected Revenue % | |
| NSW | 0.0 | 11.9 |
| Victoria | 17.9 | 15.3 |
| Queensland | 12.7 | 13.1 |
| WA | 7.9 | 15.2 |
| SA | 5.5 | 13.6 |
| Tasmania | 3.4 | 29.4 |
| NT | 1.2 | 10.9 |
| ACT | 1.6 | 16.3 |
| State Sector | 70.2 | 13.9 |
Source: State and Commonwealth Budget Papers.
The two main sources of revenue growth were Commonwealth grants -- (both GST and tied grants) -- and own-State taxes. (7)
As shown in Table 2, grant revenue grew more rapidly than expected and own-State tax revenue did not shrink as forecast. The more robust growth in grants and own-tax revenue generated a $50.5 billion "grant-tax windfall" for the States. This was equivalent to a 12.5 per cent increase in income from these sources over the five-year period. Put another way, the State sector received 12.5% or $50.5 billion more revenue from grants and own-taxes then expected.
Table 2: State Sector: Grant and Own-Tax Revenue Windfall 2000/01–2004/05
| Own-Tax Windfall | Grants Windfall | Grants + Own-Tax Windfall | |
| $ billion | $ billion | $ billion | |
| NSW | 9.5 | 4.8 | 14.3 |
| Share of total | (15.4) | (6.3) | (10.5) |
| Victoria | 7.0 | 4.0 | 11.0 |
| Share of total | (17.8) | (7.1) | (11.5) |
| Queensland | 5.5 | 7.1 | 12.6 |
| Share of total | (24.1) | (15/0) | (18.0) |
| WA | 2.9 | 3.0 | 6.0 |
| Share of total | (20.0) | (11.8) | (14.8) |
| SA | 2.2 | 1.6 | 3.8 |
| Share of total | (20.9) | (7.1) | (11.5) |
| Tasmania | 0.4 | 1.1 | 1.5 |
| Share of total | (16.7) | (13.1) | (13.9) |
| NT | 0.04 | 0.7 | 0.8 |
| Share of total | (3.4) | (8.3) | (7.7) |
| ACT | 0.65 | 0.04 | 0.7 |
| Share of total | (24.6) | (0.7) | (8.8) |
| All States/Territories | 28.2 | 22.3 | 50.5 |
| Share of total | (18.2) | (9.0) | (12.5) |
Source: State and Commonwealth Budget Papers.
Note: Grants include general purpose or GST grants and tied grants, and table does not necessarily add due to rounding.
All States, with the exception of the two Territories, received a large grant+tax windfall. Queensland benefited the most, with a grant+tax windfall of $12.6 billion or 18 per cent of total forecast revenue. Queensland not only benefited from higher-than-expected grants (up 15 per cent) but also from a large unplanned increase in own-tax receipts (up 24.1 per cent).
WA and Tasmania also received large windfalls from both own-taxes and grants. WA, which, along with NSW has been most tardy in meeting its GST commitments to cut agreed taxes, received an extra $2.9 billion (20.0 per cent) in own-tax receipts and an extra $3.0 billion (11.8 per cent) in Commonwealth grants. Tasmania received an own-tax windfall (13.1 per cent) and a grant windfall (16.7 per cent).
While the other States received more modest windfalls from grants of between 6.3 per cent (NSW) to 7.1 per cent (Victoria and SA), they all received large double-digit windfalls from own-tax sources. SA received a massive 20.9 per cent own-tax windfall while Victoria and NSW received windfalls of 17.8 per cent and 15.4 per cent respectively.
NSW, which been most aggressive on the tax front in terms of raising taxes and reluctance to meet its GST obligations to cut taxes, received a grant-tax windfall of $14.3 billion (equivalent to 10.5 per cent more revenue than forecast at the time the GST deal was agreed). Importantly, while the growth in grants income to NSW has not been as rapid as that experienced by some of the smaller States, it nonetheless received more funds than it expected and is now a net beneficiary of the GST -- five years earlier than first predicted.
The two territories, NT and ACT, have received the smallest grant-tax windfalls to date, largely because of their dependence on grants. While the ACT received the largest own-tax windfall (24.6 per cent) its gain from its main source of income, Commonwealth grants, was modest. The NT received a modest boost from grants and an even more modest gain from own-taxes.
OWN-TAX WINDFALL
While the GST has provided the States with substantial additional revenue, the States' own taxes have been the main source of gains. Own-tax receipts of the State sector were $28 billion or 18 per cent higher than expected over the period, compared with unexpected gains from the GST of $22 billion or 9 per cent (see Table 2).
All taxes proved to be much more resilient and lucrative than expected.
Payroll and land tax -- the States' broadest-based taxes -- grew on average by 6.9 per cent and 17.4 per cent per year respectively over the five years through 2004/05 (see Table 3). However, the main source of additional revenue were the remaining stamp duties -- in particular those applied to conveyances and insurance -- the State sector's two worst taxes.
Table 3: State Sector: Growth in Tax Receipts 1999/00 - 2004/05
| Tax Types | $ billion | Average Annual Growth (%) |
| Payroll | 3.1 | 6.9 |
| Conveyances | 4.1 | 73.3 |
| Insurance | 1.4 | 63.7 |
| Gambling | 0.1 | -2.4 |
| Motor Vehicles | 1.9 | 40.5 |
| Land | 1.7 | 17.4 |
| Tall Taxes | 3.8 | 9.9 |
Source: ABS, Taxation Revenue 2004-05, 5506.0.
Note: The taxes including Financial Institution duty, petrol liquor and tobacco excise fees and various stamp duties that were eliminated or phased-out as part of the GST deal are not listed. Thus the columns are not additive.
Revenue from stamp duties on conveyances grew over the period by a massive 73.3 per cent or by $4.1 billion.
Revenue from stamp duties on insurance grew by 63.7 per cent over the period, thanks primarily to the inflation in insurance prices following the collapse of HIH insurance, the imposition of the GST and, in some States, higher tax rates.
The only main area of State taxation that did not increase over the first half of the current decade was gambling. Total tax collections on gambling declined over the period by 2.4 per cent across the State sector. This was caused by replacement of some gambling taxes by the GST and by policy decisions in some States to reduce the tax take.
The bottom line is that all States have benefited significantly from the introduction of the GST. They received substantially more revenue than was expected at the time the Inter Governmental Agreement (IGA) was signed. Grant income has been far higher than expected and own-tax receipts have been far more buoyant than expected.
The funds received in the form of higher-than-expected GST payments alone have been sufficient to have allowed all States to meet their tax-cutting commitments under the IGA. But, so far, none has done so.
Indeed, the windfall revenue has also been adequate for the States to have gone beyond the GST agreement and used their windfall revenue to cut or reform their remaining taxes, but they have also failed to do that too.
The grant+tax windfall or reform bonus has also been large enough to have funded the Next Wave reform initiative being promoted by the States, but not undertaken -- supposedly for lack of funds.
THE SPENDING SPREE
In the main, the States have squandered their reform bonus. While there is variation among the individual States in terms of fiscal performance, through a combination of sloppy budgeting, failure to control public service wages, and a propensity to throw money at problems, they have, in aggregate, consumed their reform bonus without undertaking reform or investing in infrastructure.
In 2000/01, the States projected recurrent spending to grow at a modest rate of 3.8 per cent per year over the subsequent five years. That is, they planned to keep spending within the limits set by expected revenue growth and the desire to retain balanced budgets.
However, as revenue exceeded expectations, the States allowed recurrent spending to grow, often in an unplanned manner, driven by excessive wage deals with the public sector workforce. As a result, recurrent spending grew by an average 7.8 per cent per year over the five-year period -- more than double the planned rate.
As shown in Table 4, over the five year period, recurrent spending by the State sector was $66 billion or 13.4 per cent above initial expectations. (See Graph 2.)
Table 4. States: Extra Recurrent Spending 2000/01 to 2004/05
| $ billion | As % of forecast spending | As % of windfall revenue | |
| NSW | 23.4 | 14.8 | 117 |
| Victoria | 14.2 | 13.3 | 79 |
| Queensland | 8.6 | 19.0 | 68 |
| WA | 6.5 | 12.6 | 82 |
| SA | 4.9 | 12.0 | 89 |
| Tasmania | 3.4 | 31.6 | 100 |
| NT | 2.0 | 15.7 | 167 |
| ACT | 1.6 | 21.4 | 100 |
| Total | 66 | 13.4 | 93 |
Source: State and Commonwealth Budget Papers.
Note: Revenue not spent on recurrent outlays is can be invested by reducing debt, adding to financial or spending on physical asset.
Graph 2: Recurrent Outlays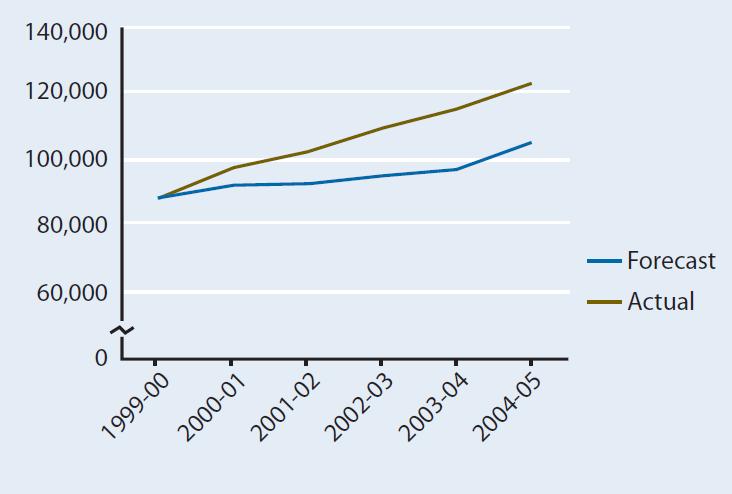
All States participated in the spending spree. Tasmania led the way with recurrent spending 32 per cent above expectation over the five-year period. It was followed by the ACT (21.4 per cent), Queensland (19 per cent), NT (15.7 per cent), NSW (14.8 per cent), Victoria (13.3 per cent), WA (12.6 per cent ) and SA (12 per cent).
The State sector as a whole did increase investment on new and additional capital works -- by about $21 billion over the period's first five years. (8) However, this spending was funded, in the main, through the use of cash balances or new borrowings rather than from revenue windfalls. Indeed, only 7 per cent of the States sector revenue windfall has been spent on investment whether in the form of new capital or debt reduction (see third column Table 4).
There was a great deal of variation among the States in terms of the extent to which their revenue windfalls were allocated between consumption and capital.
Queensland, which received a relatively large windfall, allocated a sizeable share (32 per cent) of its windfall to investment. In contrast, Tasmania which received the largest windfall in percentage terms spent all of it on consumption.
Victoria also allocated a significant portion (21 per cent) of its windfall to investment. NSW, on the other hand, increased recurrent spending by more than its windfall.
The States have regularly justified their failure to cut taxes on the grounds that they need to spend more on infrastructure. Indeed this was the basis of their decision in 2005 to renege on their commitments to cut stamp duties under the GST deal. However, as shown above, collectively the States have failed to use their gains from higher taxation to fund new infrastructure.
WINDFALL TO THE BUREAUCRATS
The main focus of the States' spending spree has been public service salaries.
The data provided by the States on their salaries and employment levels is limited, patchy and incompatible, rendering an accurate assessment of trends impossible. Indeed, only two States (Victoria and NSW) provided forward estimates of employee entitlements on a national accounts basis over the period in question, and no State provides information on trends in employee numbers or salary movements in its budget papers.
Table 5 presents the best available data on staffing trends in the States. While there is substantial variation across States and years, there are a couple of noticeable common trends.
Table 5: Growth in State Employees: Salaries and Staff Numbers
| Employee entitlements Average annual growth * % | Employee Numbers growth *** % | ||
| 1999/00- 2004/05 | 2003/04- 2005/06 | Nov 1999-Nov 2005 | |
| NSW | 7.5 | 8.9 | 6.9 |
| Victoria | 7.4 | 10.0 | 21.5 |
| Queensland | 10.1 | 9.6 | 9.7 |
| WA | 6.9 | 9.0 | 15.4 |
| SA | 6.8 | 8.5 | 17.0 |
| Tasmania | 5.8 | 11.3 | 19.5 |
| NT | n.a. | 6.9 | 24.1 |
| ACT | 8.4 | 12.6 | 3.9 |
| State Sector | 7.8 | 9.3 | 11.7 |
Source: * State Budget papers,
** ABS, Wages & Salary Earners: Public Sector, 6248.0.55.001.
There has been substantial growth in expenditure on employee entitlements over the first five years of this decade -- averaging 7.8 per cent per year for the sector as a whole. This compares with a forecast growth of between 3.7 to 4.7 per cent. (9)
The rate of growth in employee entitlements tended to increase as the decade progressed, with the average growth rate over the three years to 2005/06 being 9.3 per cent across the State sector. The State sector also increased its workforce by 11.7 per cent over the period.
Queensland has produced the most rapid growth in spending on public employees, averaging 10.1 per cent per year for the five-year period, with Tasmania producing the lowest rate of growth (5.8 per cent). However, Tasmania has rapidly made up the difference, with its public sector wages bill growing by over 11.3 per cent per year over the last three years. The promises made by the Tasmanian Labor Government in the recent State election will ensure that the wages bill continues to grow at this rapid rate.
The ACT has also allowed spending on public sector wages to get out of control, allowing public employee entitlements to grow, on average, by 12.6 per cent per year over the last three years. Given the relatively low rate of growth in public servant numbers, it appears that the ACT has concentrated its additional spending on higher wages rather than greater numbers.
NSW appears to be following a similar path to that of the ACT. It has kept growth in the size of the public sector workforce down to 6.9 per cent over the last five years, while allowing wages to blow out by 8.9 per cent per year in the last three years.
The States would argue that this spending was justified as it was used to attract and retain the best front-line professionals and thereby increase the effectiveness of these services. The states have increased staffing levels and the wages of front-line staff.
As shown in Table 6, between May 1999 and Nov 2005, the State sector increased employment of education professionals by 56,100 (or 11.2 per cent) and health professionals by 36.400 (or 10.7 per cent).
Table 6: States: Growth in Education, Health and Administrative Staff
(May 1999 to May 2005)
| Staff numbers (’000) | Growth in numbers (%) | |
| Education | 56.1 | 11.2 |
| Health | 36.4 | 10.7 |
| Administrators | 44.0 | 30.5 |
| Total | 126 | 10.4 |
Source: ABS, Wages & Salary Earners: Public Sector, 6248.0.55.001.
During this same period, however, the States increased their administrator or bureaucrat workforce by 44,000 or 30.5 per cent. Clearly, therefore, front-line staff have not been the States' sole focus.
Moreover, additional spending on front-line services is only justified if it increases the quality and capacity of the services and meets the demands of clients. While it is not possible to provide a thorough assessment of the performance of State services, there are some clear indications that the increase in expenditures on front-line services has not been matched by comparable improvements in output.
For example, despite significant increases in expenditure on public schools -- mainly on more and higher paid teachers -- the number of students attending public schools continued to decline over the decade. Indeed, in 2004/05, there were 20,000 fewer students in public schools in Australia than at the start of the decade, and the greatest decline took place in the most recent years when the growth in teacher numbers and wages was most rapid. (10) In contrast, despite high fees, families are increasingly voting with their feet against the State school systems and placing their children in private schools. Both in terms of raw numbers and in its share of total students, the private school sector has shown continuous growth. (11)
The States have focused a great deal of their additional expenditure on public hospitals, again mainly on additional and higher paid staff. Despite this investment, waiting times have continued to increase and through-put (separations) in all public hospitals has grown slowly (4.2 per cent over five years). (12) There are, however, substantial variations between States -- NSW is going backwards while Victoria is showing signs of improvement.
REVENUE GAINS: STATES vs COMMONWEALTH A continuing complaint of the States, used as an excuse not to undertake reform, is that despite receiving the GST, they still do not receive a fair share of total tax revenue. This claim is not supported by the evidence. The Commonwealth Government has experienced rapid growth in revenue. Over the 2000/01-2004/05 period, the Commonwealth's own revenue -- total revenue less grants paid to the States -- grew at an average annual rate of 7.5 per cent per year, which, by any measure, constitutes rapid growth. In contrast, over the same period, State sector receipts from grants and own-taxes grew at an average rate of 8.0 per cent per year. The Commonwealth has also increased its spending on its own purposes at a very rapid rate of 8.7 per cent per year. In contrast, recurrent own-purpose spending by the States grew, on average, by 7.8 per cent per year. If spending on capital -- of which the Commonwealth does little -- is included, the records on spending by the State and Commonwealth sectors are about on a par. The big difference between the two levels of government lies with tax cuts and reform. In sharp contrast to the States, the Commonwealth has regularly shared some of its reform bonus with taxpayers. During the period in question, the Commonwealth cut company tax to 30 per cent; raised personal income tax thresholds; cut the capital gains tax rate, and cut the rate and level of taxes on superannuation. While these changes did not constitute major tax reform, they do constitute a far greater willingness to share the benefits of reform with taxpayers than has been exhibited by the States. Also in contrast to the States, the Howard Government used a sizeable portion of its reform bonus to facilitate reform. Since coming to office ten years ago, the Howard Government has instigated a series of reforms accompanied by large increases in spending designed either to bolster support or to compensate those who lost from the changes. During this decade these have included:
There can always be debate about the quality of the reform and whether the Commonwealth has been too generous with its compensation. However, at least it has used its reform bonus on further reform and shared it with taxpayers, whereas the States have not. |
What has been needed is not just more, highly paid staff, but innovation in the structure and conduct of the education and health systems. This is the main challenge of the next wave of reform. The States, as providers of the services and owner of these assets, need to play a major role. They have received the funding to begin the process. However, no State has gone down this path seriously.
Victoria is talking the talk. The other States claim to be listening. But, so far, there has been no action other than pumping more money into the status quo. The windfall revenue received, to date, has been more than sufficient to fund a major reform agenda such as the rationalisation and reform of the public hospital system. Yet rather than getting on with the task, the States have stuck their hands out, demanding even more money from the Commonwealth.
WHAT ABOUT THE FUTURE?
While the reform bonus flowing to the States as a whole is likely to wane somewhat, for most States it is expected to continue. The GST is expected to generate an extra $14 billion for the States over the next five years, with all States being net beneficiaries. (13)
Most States are also forecasting growth in own-tax receipts -- particularly in payroll tax. Land tax receipts are forecast to continue to grow in many States despite the slowing housing investment market. And some States, including Queensland and WA, expect growth in stamp duty on conveyances.
The threat to the States' finances lies not with lack of revenue growth, but with spending.
Over the last five years, all States have allowed recurrent spending to grow at a rate that exceeds revenue growth. As revenue growth slows to more sustainable rates, the States will need to cut back on spending to match their lesser -- but still abundant -- revenue flows. This will require a level of fiscal discipline that appears to be alien to the current crop of State governments.
Moreover, many States have locked in future wages growth far in excess of their revenue-raising capacity.
This task has been made more difficult by State politicians having constantly fed the public a message of cash shortage, and the need for more spending by Labor Governments in all states with their close ties to public sector unions.
Indeed, the current crisis afflicting NSW -- declining revenue, budget deficit, public sector lay-offs -- could spread to other States, with Tasmania, South Australia and the ACT being most like to follow suit given their heavy dependence on conveyances fees to fund large increase in wages.
AUGMENTING THE FLAWS IN THE SYSTEM
The failure of the States to use their reform bonus well should come as no surprise. Australia's fiscal-federal system has long inculcated a mendicant mentality among the States, and the GST deal has made this worse.
Over the decades, the Commonwealth has steadily taken over ever-greater taxing and spending powers from the States. It has become the States' main paymaster and has become directly and indirectly involved in just about every function of the States. The GST increased this by replacing a range of State taxes with the GST and by being packaged with more tied grants.
As a result, the Commonwealth now collects, on average, 45 per cent of the State sector's revenue and nearly 65 per cent of Tasmania's revenue. The GST also saw the Commonwealth directly assume responsibility for raising "State taxes" in all but name and for determining the composition of State taxes. And it did so in a manner that gave it little effective control over the rate and base of the GST. (14)
Despite periodic complaints, the States have, in the main, acquiesced in the Commonwealth's take-over of their taxing and spending powers. They have regularly decided that more money raised by the Commonwealth was better than raising the funds themselves. They accepted the GST deal because it gave them more money with fewer responsibilities. The GST also gave them the scope for hand-balling responsibility for their own taxes over to the Commonwealth -- as witnessed by the need for the Commonwealth to force them to meet their tax-cutting obligations under the GST.
The extensive overlap and duplication between the States and the Commonwealth in the delivery of State services has dulled the accountability of the States to their own taxpayers. Even the bureaucrats in charge struggle to disentangle the funding and policy responsibilities of the two levels of government. However, since the Commonwealth controls the purse strings, it is seen by the electorate as the responsible party, even when it is not.
States' accountability is further undermined by the process used to allocate grants to the States. Under the system, administered by the Commonwealth Grants Commission (CGC), GST grants are not allocated according to where they originated, but on a welfare basis aimed at allowing all States to provide the same set and levels of services, irrespective of their ability to raise revenue or of the cost of providing those services.
The CGC process is complex and comprehensive. It considers all State revenue, not merely GST receipts. Its impacts are understood by few.
While the CGC tries to make the system policy-neutral, it fails to do so. In fact, poor policy decisions are rewarded rather than successful ones. If a State commits to a policy which lowers its future growth -- for example, stopping industrial development -- it will eventually be compensated, in part, with higher grants.
The distortions of the system are dynamic and cumulative. The system has been in place for decades, and its effects have become entrenched in the electorate. These disincentives are greatest for the smaller States and the Territories as they are more dependent on the Commonwealth for revenue.
The GST has significantly increased the volume of funds pumped to the States through the CGC's system and augmented its distortions.
The quality of the States' fiscal decisions is also undermined by the structure of their tax systems. The principle of a good tax is that it is levied on as broad and steady a base as possible, with as few rates as possible. The aim is not only to minimise the adverse economic impacts of a tax, but to improve its transparency and fairness. The broader the base, the fewer the exemptions, the greater its transparency and the more it is shared amongst the electorate. The States' tax systems violate these principles -- both in terms of the tax mix and the structure of individual taxes.
They do so, not as the States claim because of the lack of a broadly based tax, but because of the States' desire to avoid accountability. The States have long had two potential growth taxes -- payroll tax and land tax. The base of both these taxes is potentially large and tends to grow with the economy as a whole. In fact, in the 1970s, in response to demands for a "growth tax", the Commonwealth eliminated its payroll tax to create space for the States. The States duly took up the tax and it quickly became the States' largest tax source. Over time, however, the States have systematically distorted their payroll tax systems by levying it on employers rather than employees, by increasing the tax rate, by exempting "small business", allowing a large range of exemptions and by widening the range of income included in the base. As it now stands, only about 11 per cent of firms pay payroll tax and the top rate of tax is 6 per cent. A similar process has been applied to land tax. As a result, these taxes do not raise as much money as they could, distort economic decisions and force the States to rely on even worse taxes such as stamp duties.
REFORM OPTIONS
It is tempting to argue for the renegotiation of the GST deal. The deal was flawed. It failed to achieve its aims of reforming the indirect tax system, and it allowed the States to reap, and to an extent waste, a huge reform bonus.
It also gave the States enough money to drown the voices of opposition, thus dulling the most potential sources of accountability in our democratic system.
The fact is that the deal is effectively set in stone. It is the subject of an IGA which in turn is enshrined in Commonwealth law. Under this law, any changes to the tax base, or rate, or means by which is distributed to the States requires the unanimous support of governments at both levels.
It is also tempting to urge the Commonwealth to take on a greater role to ensure that the States pursue reform and to ensure that at least the funds raised and handed to them by the Commonwealth are spent well.
However, this is likely to further erode the accountability of the States and the functioning of the federal system. The key reason for the failure of the States to spend their reform bonus well is that the federal system shelters them from accountability. The Commonwealth is not an adequate surrogate for direct accountability. Moreover, the Commonwealth has proven to be more interested in taking over State functions and dictating State policies than it has in being an agent of State accountability.
The solution lies with rebuilding the functioning of the federal system. This must include more intense scrutiny of the performance of the States and their own citizens holding them politically accountable for their actions.
It is also time to put reform of the federal system back on the agenda and this must include reducing state dependence on the Commonwealth for revenue.
ENDNOTES
1. COAG, National Reform Initiative Working Group's Report to COAG
2. Press Release, "Feds must show states the money for reform agenda", 28 March 2006
3. Reported in M. Steketee, "Unwanted, but state governments are here to stay", The Australian, 27 April 2006.
4. Ibid.
5. In 2000/01, when the GST was first introduced, each of the States produced a set of forward estimates formulated on a common basis which projected the expected level of revenue, expenditure and budget balances for the next three years. These were used as the basis for negotiating the GST deal and for planning spending and revenue collection policies. Combining the 2000/01 forward estimates (which cover four years) with those for 2004/05 gives an estimate of the governments' revenue and spending expectations during the first five years of the GST (from 2000/01 to 2004/05).
By comparing these with the actual results (something no government does, other than for the year just completed) one can obtain an estimate about whether revenue, outlays and borrowings exceeded expectations -- in other words, whether the States have gained or lost from the introduction of the GST.
These forecasts were undoubtedly pessimistic. All State treasuries, and, for that matter, Federal treasuries, have a tendency to take a conservative approach to forecasting future revenue flows, as the last thing they want to do is encourage their political masters to spend revenue which they do not have or might not receive. In the case of the GST, the incentives towards pessimism were even stronger. Low rates of growth in revenue would not only help convince the Commonwealth to provide higher minimum payments, but help keep the use of windfall revenue off the agenda.
Nonetheless, these are the official forecasts, and the forecasts used to set tax and expenditure policy and negotiate the GST. They are, therefore, the benchmarks against which the States should be judged.
6. Comparing the actual results obtained from the various budget papers 1999/00 to 2005/06 inclusive. The forward estimates were, as discussed in footnote 3, obtained from those presented in a national account basis in the 2000/01 budget paper (for the years 2000/01 through 2003/04) and the 2001/02 budget papers (for 2004/05).
7. The state budget or general government sector has numerous sources of funding. Two of the largest are grants and taxation which together make up between 73 per cent (QLD) to 82 per cent (SA) of total revenue. The other sources include fees and fines (which have grown markedly in some state, particularly Victoria), payments from public trading business enterprises and earning on investments.
For over a decade all states have pursued a policy of setting aside funds to meet future public sector superannuation liabilities. Queensland has been pursuing this policy for longest and has accumulated a very large fund -- in excess of $15 billion. These funds have in the main been invested in the stock market and have generated large increases in earning in recent years. These earnings are passed back into the budget and represent a large source of revenue growth in many states. In most cases these earnings have been used to reinvest in meeting future superannuation liabilities and thus reduces state liabilities.
In some states -- such as Queensland, which has already fully funded its future superannuation -- the earning above newly accruing liabilities is put into general revenue. It must be noted that the policy of fully funding super is a sound investment in the future, at least to the extent that the expenditure growth referred in this paper is driven by the full funding of super.
8. State and territory budget papers 1999/00 through 2005/06.
9. As reported in State budget papers.
10. Commonwealth Grants Commission, State Finances -- Report on State Revenue Sharing Relativities 2006, Update Documents, Appendix B, Table B-12.
11. Productivity Commission, Report on Government Services 2006
12. Report on Government Services 2006, Volume 2, Attachment: Public Hospitals, Table 9A.7, Productivity Commission, January 2006.
13. As a result of it reluctantly agreeing to cut the taxes as agreed under the GST Deal, NSW will not be a net beneficiary from the GST in 2006-07, but it will be in subsequent years. Source: 2006-07 Commonwealth Budget, Budget Paper No. 3.
14. Under the Inter Government Agreement, neither the GST, nor the base, nor the method of redistributing it can be changed without the unanimous agreement of the States. The IGA was subsequently incorporated into Commonwealth legislation. As a result, the Commonwealth gave away any ability to alter the GST.
No comments:
Post a Comment