Chapter 11 of Competitive Electricity Markets
SUMMARY
Among the many issues with which electricity market designers have wrestled is how to ensure reliable and uninterrupted supply. The concerns cover both short-run operations and longer-term investment adequacy, the issue on which this chapter is focused. Electricity is jointly supplied to the whole community, has virtually no storage capabilities, and faces a peaky demand with little capacity or desire of consumers to respond to excess demand (and hence price surges) by reducing their demand. In addition, it is subject to political oversight of prices and many facets of supply.
Many have argued that as a result there will be "missing money" in the market and that we must, therefore, have a dual market for electricity generation, covering energy on the one hand and capacity on the other. Similar issues are present with electricity transmission where virtually all markets involve forms of regulated supply.
This chapter finds that a reasonably efficient market has been achieved in Australia without regulation of generation. The outcome, which is not without some fragilities, has been due to generally less government intervention than seen in some other markets, with a higher reserve intervention price, less distortive consumer price caps, and a genuine level of retail competition that provides good market signals for new capacity.
1. INTRODUCTION
A key debate surrounding electricity markets remains the general question of resource adequacy -- i.e., can we leave investment in long-lead time and long-lived assets, producing a product essential to every other part of the economy to the chaos of a free market? Many commentators, indeed many market designs, promote capacity obligations to underpin a certain amount of generation investment regardless of energy price signals. These designs, in turn, provoke great debates as to whether they are themselves efficient, or are achieving their objectives, i.e. whether the new investment is sufficient.
The notion that energy-only markets cannot provide adequate reliability is most directly addressed within a robust theoretical framework by Stoft (2002), though it derives from the concept, developed by Boiteux (1949), of electrical energy being two goods: reliability and immediate power. Oren (2000) has also supported a form of capacity payment as well as an energy market, though as a second best approach in light of a seeming inevitability that governments would always intervene in this market to prevent very high prices. Within Australia, Simshauser (2006) has been an active proponent of capacity markets.
Caramanis (1982) was an early advocate of an energy-only market and demonstrated the conditions under which this could operate. He and others looked to the removal of government regulations on pricing and plant development to ensure adequate investment in new capacity. Cramton and Stoft (2006) cite Joskow (2006) in defining the conditions that prevent markets from operating to provide optimal capacity when it is needed. Joskow says:
The problems include: [1] price caps on energy ...[2] market power mitigation mechanisms that do not allow prices to rise high enough during conditions when generating capacity is fully utilised ...[3] actions by system operators that have the effect of keeping prices from rising fast enough and high enough to reflect the value of lost load ...[4] reliability actions taken by system operators that rely on Out of Market (OOM) calls on generators that pay some generators premium prices but depress the market prices paid to other suppliers, ...[5] payments by system operators to keep inefficient generators in service due to transmission and related constraints rather than allowing them to be retired or be mothballed, ...[6] regulated generators operating within a competitive market that have poor incentives to make efficient retirement decisions, depressing market prices for energy.
All of these problems represent market corruption by the regulatory authorities. In essence, all of them are measures taken to avoid having price undertake its conventional role of determining what is to be supplied to the market. They represent either a mistrust that price will offer the correct signals or that allowing the necessary prices to be visible will spark political concerns.
Reviewing the UK market which has had experience of both a capacity payment and the current NETA energy-only market, Roques et al. (2005) are neutral between the two. They argue, however, that the current UK balancing mechanism which has two prices (unlike Australia's single pool price) mutes signals and should be changed if an energy-only market is to operate effectively.
This chapter examines the concerns about resource adequacy in the context of the "energy-only" Australian National Electricity Market (NEM). It argues that the NEM has worked well. Prices have remained among the lowest in the world, reliability has been maintained, and the market has produced new generation investment of the magnitude, type, and timing that has been appropriate. These results point to the superiority, at least in the Australian context, of an energy-only market approach that operates without the potential distortions that separate capacity payments bring.
Key reasons for this success include a relatively high wholesale reserve price at $A 10 000/MWh. In the US, price caps are set at much lower levels of $400 in California and $1000 in New England, Midwest, New York, PJM, and Southwest. ERCOT is at $1500 and scheduled to increase to $3000 in 2009.
There are other features that have contributed to the NEM's energy-only market success. These include a relatively unfettered retail market that has allowed robust retail competition which provides appropriate market signals. In addition, the market design includes a transparent and flexible bidding system, including the integration of offers for frequency control and other ancillary services with energy market bids. The bidding rules allow multiple- and short-timeframe changes. Although there are certain constraints on generators' actions in this regard, these are designed to prevent a generator bidding erratically to destabilise the market and impose costs on competitors. This is further discussed in Section 4.3.
Even though the Australian market is one of the most lightly regulated in the world, it has its fragilities. These stem from actual or potential government intervention. They include:
- Will provisions for intervention when short-term supply is judged to be inadequate result in a dual market, depress some prices and deter new investment in capacity?
- Are all government generation investments genuinely commercial and, if not, will this deter new private investment and reduce capacity by more than is created?
- How are we to cope with greenhouse issues which present a risk and some reality of carbon tax/trading schemes?
These matters are discussed in the context of the NEM, its history market structure, and outcomes in terms of prices, supply productivity, and reliability.
Also addressed are the more intractable problems that seem to be present in ensuring adequate investment in transmission in view of its features as both a competitor and a vehicle for generation. The chapter explores measures to facilitate efficient transmission investment without central planning.
2. MARKET HISTORY AND OUTCOMES
2.1. SIZE AND NATURE OF THE AUSTRALIAN RETICULATED ENERGY MARKET
The Australian National Electricity Market (NEM), now covering all jurisdictions apart from Western Australia and the Northern Territory and close to 95% of consumers, has been in operation since the late 1990s. It is a market that has some government and regulatory intervention: much of the industry remains in government ownership; some retail caps continue in place; there is regulatory uncertainty regarding environmental conditions attached to new generation plant; and there are seemingly endemic debates that precede new transmission developments.
Electricity dominates reticulated energy supply, though gas is also important both in its own right and as a fuel for electricity (gas accounts for about 8 per cent of generation). Figure 1 shows the market profile of Australian jurisdictions.
2.2. THE REFORMS OF THE 1990S
Historically, Australian electricity supply, like that of most European countries, was reserved for government ownership. This grew up partly because of concerns about natural monopoly that under private enterprise might exploit customers, partly because electricity (and gas) was seen as part of the "commanding heights" of commerce that only government should control. In addition, production and supply of electricity was considered to require a level of coordination than many in politics thought it impossible for competing producers to accommodate.
In 1992, Australia's electricity industry comprised seven jurisdictionally based integrated utilities that had total control over generation and sales within their respective states. Competition from other suppliers and retailers was illegal.
Fig. 1. Australian energy market -- Consumption by state. Note: Gas consumption has been converted from PJ to GWh.
As in a great many countries, the early 1990s saw an increased awareness in Australia of the shortcomings of the integrated electricity industry's efficiency. A better appreciation developed of the nature of the industry. This included a realisation that the industry need not operate as an integrated unitary monopoly, and that some considerable economies were being delivered in the England and Wales electricity market, the previously integrated nature of which had been the blueprint for the separate Australian systems. On top of this, private ownership was being recognised as providing efficiency premiums over government-owned systems, not only in the newly privatised England and Wales industry but also in the mainly private systems that had long been standard in the US. Formal reports by government and private economic policy institutions [e.g. Industry Commission (1991); Institute of Public Affairs (1991)] lent weight to the evidence of inefficiency in Australia compared to elsewhere.
There was also a rare level of political consensus developing in favor of greater competition as a means of improving Australian economic outcomes. A major report (National Competition Policy, 1993) had led to the agreement by the federal government to provide additional funding of the state governments on condition that the latter structurally separated the parts of their network industries that were natural monopolies from those where competition was possible. This was to be followed by the opening up of their local markets to competition.
Electricity was the industry where these conditions were most obviously present and was singled out for particular attention. Unbundling the monopolies meant dividing each of the single state government generation and retail businesses into rival firms. It also meant requiring transmission systems to be opened on the basis of non-discriminatory access and with generators being scheduled on the basis of their bid offers.
An important factor in the evolution of the industry into a competitive market was the parlous nature of state government finances in Victoria and South Australia after a period of barely restrained expenditure increases. In Victoria, the consequent level of debt provided an incoming Liberal (conservative) government with a justification for pursuing privatisation, which is never a politically popular course in Australia. The Victorian government's most valuable asset capable of being privatised was the electricity industry.
In privatising the electricity industry, the UK model provided a guide. In advance of the federal government's requirements to do so, the state government first disaggregated the electricity monopoly to bring about structural separation of the generation, transmission, and retail/distribution functions, and to ensure multiple competitive providers for generation and retailing (which was left with distribution but with a clear administrative separation). The natural monopoly poles and wires businesses were regulated under a UK-style price setting regime.
2.3. AUSTRALIA'S MARKET DESIGN
The Australian National (1) Electricity Market was guided by, but also avoided some of the mistakes of, the UK's original gross pool design.
Like the UK, it benefited from historic government ownership by allowing a step-wise transformation without excessive compromise to protect legacy positions. Unlike the UK, however, the federal system of government, with states responsible for energy, presented significant challenges. Nevertheless, thanks to a rare alignment of state desires and federal threats and funding, the NEM did form in 1998.
The key starting advantages over the UK centralised mandatory pool were:
- A competitive generator ownership structure;
- A purist "energy-only" market design, without capacity payments and with selfcommitment without uplift compensation;
- A degree of locational pricing through market zones or "regions" without constrained uplift payments;
- A five-minute, "real-time" price, with re-bidding allowed up to the point of dispatch; and
- Transmission planning and operation separated from the independent market/system operator.
Other key features of the NEM included:
- the separation of monopoly networks from retail and transmission with the networks operations (and most augmentations) funded by regulated charges on customers;
- a phased introduction of retail competition and associated vesting contracts; and
- a "VoLL", or wholesale price cap, approaching the true cost of consumer interruption.
The "pure" nature of the energy price, i.e. unadulterated by forms of uplift, has ensured that generators and retailers trade an identical commodity, and can easily deal in the forward market (see Fig. 2). It leaves each of the various players -- retailers, customers, and generators -- with their own responsibility of ensuring their ongoing viability and profitability. The NEM's forward markets have achieved quite reasonable turnover and liquidity considering the small physical size, challenging claims that a gross pool design limits forward market participation. Indeed, the Australian market, though based on a pool and spot price, is fundamentally one of contracts, which are settled on a contracts-for-difference basis.
Fig. 2. Market design.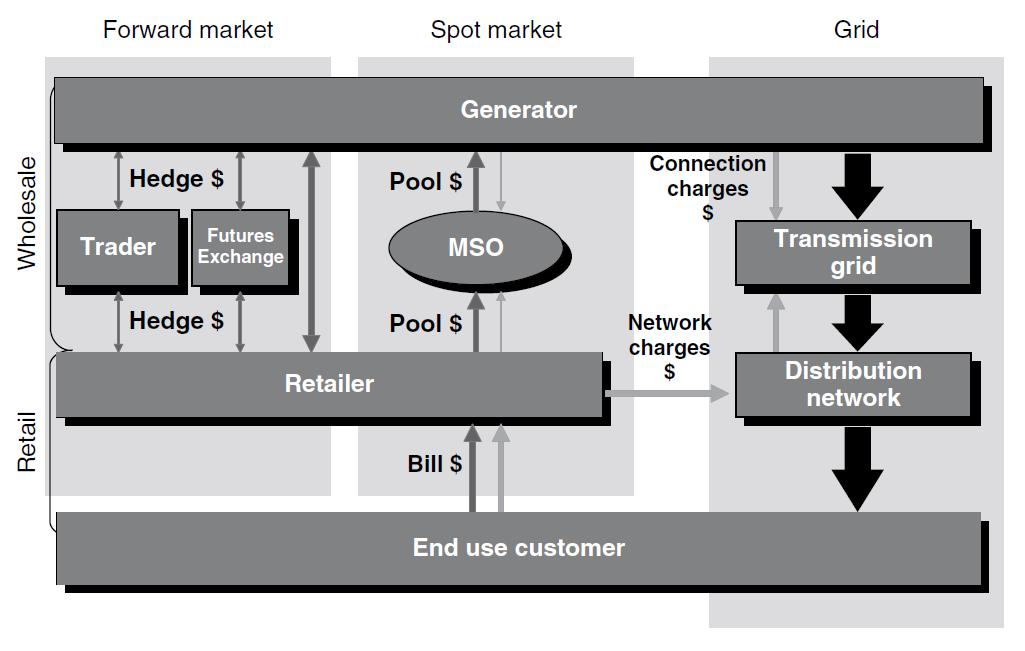
Whilst the advantages of locational pricing and energy-only markets are well discussed in the literature, some other less well-known features of the NEM's dispatch and pricing process have equally contributed to its success.
The five-minute pricing and dispatch cycle allowed effectively real-time balancing of supply and demand, with prices non-firm until the moment of dispatch. This permits simplification of electricity price to one value, the energy price, to which the supplier and consumer are equally exposed.
- The market/system operator makes no inter-temporal dispatch decisions. There is no day-ahead pricing nor central commitment. Thus, there is no market exposure to MSO forecasting error and the commensurate uplift charge.
- "Ancillary services" are limited to balancing the market within a five-minute dispatch cycle, where generators and interruptible customers are paid for the service of providing some contingency spinning reserve to control frequency until the next cycle. The power system only needs a small volume of reserve for five-minute balancing, about 1.5% of underlying demand, and there are many competitive providers. Turnover in that market is about 1% of that in the energy market. These services are largely supplied on a spot bidding system (which is pragmatically linked with the general energy bidding) funded by a separate "causer pays" charge. Even these have common market prices that can be hedged, although the low and stable price has brought little demand for this.
Rather than having various forms of central decisions and administered payments to maintain an orderly power system -- for example, centrally guaranteed day-ahead pricing for demand-side response and slow-start committing units -- the Australian system leaves the responsibility for taking these decisions to providers who do so in the light of their own capabilities and commercial options. If, for operational reasons, they physically need to lock in decisions 24 hours ahead, they can do that contractually and it does not need to be underwritten centrally.
There are many problems in Market Operators making forward decisions, including complexity, gaming opportunities, perverse incentives against flexibility, etc., but the most obvious problem is error. Australian electricity demand is notoriously unpredictable, a day-ahead Market Operator who predicts a high demand, will set high day-ahead prices and be embarrassed when the demand fails to eventuate. Moreover, the artificially high prices will discourage demand that is clearly suppliable.
The move to real-time self-commitment was met with skepticism by those who prefer others to take the forecasting risk. But after the decision was made in the mid-1990s, the commercial rewards available by ensuring physical flexibility and speed brought entrepreneurial reactions. Peaking units that for decades had demanded from the operator a minimum of five hours notice of recall discovered ways to start within two. The same is also true for the relatively insignificant suppliers from the demand-side. And such improvements in flexibility, in addition to rewarding the supplier, also provide a cost saving bonus to the consumer in general by putting downward pressure on prices.
The success of the NEM, notwithstanding it being clouded by a less than minimal set of interventions by governments, appears to corroborate initial analyses that the electricity market is not markedly different from other markets. To be sure, there are externalities, and a failure by one party can have repercussions across a great many others, but this is also true of many other markets with independent agents in the supply chain. And if the instantaneous nature of electricity is unique, other industries' supply characteristics are converging toward this as modern production methods are characterised by considerable economising in inventories and other buffers.
2.4. MARKET STRUCTURE
The history of state government-owned monopoly allowed governments to design a structure alongside a market. This implemented the mid-1990s prevailing view of an ideal industry structure, with numerous generators, stapled retailer/distributors, and large monopoly transmission companies. Since that time, the notable new trends are:
- Self-imposed separation of network and retail businesses;
- Aggregation of network businesses, including distribution and transmission, with regulatory blessing;
- Aggregation of retailing without much regulatory acceptance; and
- Vertical integration of generation and retailing despite regulatory resistance.
2.4.1. Generation
Despite numerous ownership transactions, the generation sector remains about as aggregated as it was when first split by the governments (see Fig. 3). In a national sense, there is a highly competitive market in terms of capacity, though at particular times a supplier can find itself with market power. The market is more concentrated when viewed in a locational sense. In particular, Tasmania is dominated by one government-owned generator, and South Australia's largest generator comprises one power station that has about 40% of local capacity. Although there is a fairly robust interconnection capacity, supply between the regions is neither infinite nor risk-free. But the almost limitless opportunity for new power stations in the NEM presents a very real and effective new-entry threat to most locations.
Fig. 3. Generation ownership: Capacity by market share. Source: ESAA (Energy Supply Association of Australia) (2006) Electricity Gas Australia 2006.
Whilst the governments created a generally competitive generator structure, they faced union resistance against privatising. Only Victoria and South Australia were able to consummate the process. Queensland and NSW have held their generators on a "forthcoming auction" footing for a decade. This makes planning for the generators themselves difficult, whilst also presenting a sovereign risk for private investors who fear that the government-owned competitors may act non-commercially.
2.4.2. Retail businesses
The original retail franchisees were initially stapled with ring-fenced regulated monopoly distribution businesses over the same geographic area. This was initially feared to be a barrier to retail competition, but it subsequently became irrelevant as private owners realised that the two activities were very different, and chose to specialise by de-merging. This has also occurred with the state based retailer/distributors, informally in the case of the largest one, NSW's EnergyAustralia, which has a retail alliance with the private generator/retailer International Power, and formally for the Queensland businesses, the retail arms of which have been privatised.
At the same time, there was some retail aggregation (by government decision in NSW and driven by commercial pressures in Victoria). This reflected a view that the originally estimated minimum competitive size of around 0.5 m customers for major retailers was too low. Despite that, many niche retailers with far fewer customers have profitably entered.
The market shares of major retailers are illustrated in Fig. 4.
Fig. 4. NEM major electricity retail market shares (by customer numbers).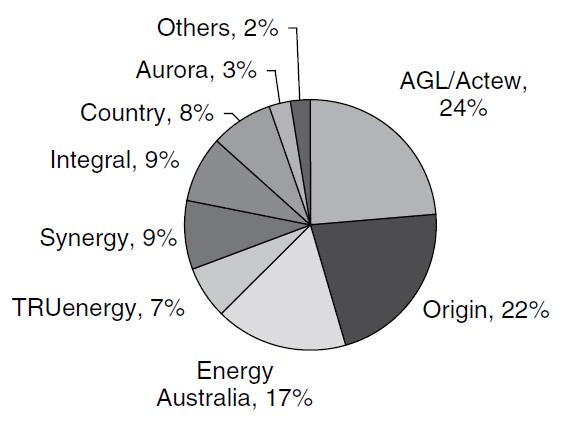 Source: UBS (Union Bank of Switzerland), 2006.
The big retailers have tried some further tactics: going "dual fuel", selling electricity and natural gas and, more controversially, merging with generators to form vertically integrated energy businesses. This was challenged by the competition regulator as limiting market entry into either generation or retailing; however, the regulator's position was overturned in court. Most retailing is now or will shortly be vertically integrated in some form with generation, yet by all measures, competition continues to strengthen at each end.
2.4.3. Distribution businesses
Specialist regulated infrastructure owners began to accumulate network businesses. As they are not by definition exposed to competition, the regulator has had no objection. However, the business models of the enlarged firms have proven especially challenging for price regulators to monitor efficient costs. Economic regulation will need to either become more intrusive -- such as the US model -- or transform to another model entirely where actual costs are less relevant.
2.4.4. Transmission and market system operator (MSO)
As a residue of the state-based system, the NEM has five transmission providers: one per state. This is clearly inefficient and state-owned transmission systems are often criticised for using their influence to favor intra-state over national solutions to transmission construction.
The states did agree to combine the market/system operator to one company, the National Electricity Market Management Co (NEMMCO) that operates all the transmission systems and generators.
2.4.5. Developments in market structure
Deregulation having shaken the ossified system up, we are now seeing the pieces reassembling. There is certainly the move toward retailing and generation forming alliances and cross ownerships. This reflects the importance of risk minimisation, especially since the price cap is set at a relatively high $10 000/MWh. Even so, there is no move toward a full integration and few consider this to be likely -- in this respect, something similar to the oil industry is taking place with firms adopting a spectrum of supply acquisition ranging from spot to ownership.
At the same time we are seeing a voluntary divorce, which nobody envisaged, between distribution and its formerly linked retailing activities -- this is also happening, in a somewhat surreptitious way, with the state-owned outfits, which are also forming marketing alliances with generation.
This is driven by risks and synergies. The fact that retailers also own some generation does not undermine the market since, even without any requirements for Chinese walls, retail buyers would not favor their affiliate. To do so would jeopardise their abilities to contract with non-affiliates and would thereby undermine their abilities to perform a key function -- risk management. In this respect, there is an analogy with the motor industry where assemblers buy components from each other, including for new models, but the component suppliers would not reveal confidential information to affiliates, because if they did so they would lose all third-party business.
3. MARKET OUTCOMES
3.1. GENERAL EXPERIENCES IN PRODUCTIVITY
In the US, there is little evidence of private ownership and other divestment, bringing about increased efficiency. Bushnell and Wolfram (2005) estimate at best a 2% improvement in fuel efficiency.
Others examining industries that were previously largely government-owned -- for example, Newbery and Pollitt (1997) -- find considerable gains with respect to privatisations in England and Wales. Similarly Fabrizio et al. (2004) found, "The performance gain of an IOU plant in a restructured regime relative to MUNI plants over the same period is ...on the order of 15% reductions in employees and 20% reductions in nonfuel expenses."
Australia's experiences show improvements across a range of indicators: industry productivity, reliability, new investment, and prices.
3.2. PRICE OUTCOMES
In the UK, the NETA market model brought a claimed 15% price reduction (on top of the 30% real reduction in 1990–2000). (2) Australia saw prices for larger customers fall 28% in 1996–1999 according to a number of surveys. Prices for smaller customers were reduced by regulators.
Although real prices in Australia have edged up recently, they remain considerably below the 1994 pre-reform levels. The easiest and least ambiguous measure is wholesale prices. Compared with a notional $40/MWh (about $50 in today's money) that was the transfer price between the affiliated branches of the state-owned business prior to reform, spot and contract prices have been as shown in Table 1 and Fig. 5.
Table 1. Average prices $/MWh
| Year | NSW | QLD | SA | SNOWY | TAS | VIC |
| 1998–1999 | 33.13 | 51.65 | 156.02 | 32.34 | | 36.33 |
| 1999–2000 | 28.27 | 44.11 | 59.27 | 27.96 | | 26.35 |
| 2000–2001 | 37.69 | 41.33 | 56.39 | 37.06 | | 44.57 |
| 2001–2002 | 34.76 | 35.34 | 31.61 | 31.59 | | 30.97 |
| 2002–2003 | 32.91 | 37.79 | 30.11 | 29.83 | | 27.56 |
| 2003–2004 | 32.37 | 28.18 | 34.86 | 30.80 | | 25.38 |
| 2004–2005 | 39.33 | 28.96 | 36.07 | 34.05 | 190.38 | 27.62 |
| 2005–2006 | 37.24 | 28.12 | 37.76 | 31.09 | 56.76 | 32.47 |
| 2006–2007 | 34.83 | 24.42 | 39.24 | 35.25 | 39.92 | 36.29 |
Source: NEMMCO
Fig. 5. Regional quarterly spot and future prices. Source: AER (Australian Energy Regulator), December 2006.
The Australian Energy Regulator (AER) analysis of flat contracts shows no general upward movement.
3.3. CHANGES IN AUSTRALIAN OPERATIONS' EFFICIENCY LEVELS
Underpinning these real price falls have been large increases in efficiency. For example, in Victoria the generators since being moved into a more competitive setting (following corporatisation in 1994 and their subsequent privatisation) have seen their workforces shrink from about 11 000 to the equivalent of less than 2500.
South Australia, the other state that has fully privatised, saw similar improvements in generators' labor productivity. Government-owned generators also improved and even Queensland (partly private-owned), which had long been better managed than other states' industries, saw a doubling in productivity. Figure 6 illustrates the different state outcomes.
Fig. 6. Generator Labour Productivity (GWh/employee). Source: ESAA, Electricity Gas Australia 2006.
Improvements were also seen in the level of reliability of the power stations, especially in Victoria and NSW, the two state systems that were previously performing poorly (see Fig. 7).
Fig. 7. Power stations' availability to run. Source: ESAA, Electricity Gas Australia 2006.
Improved productivity was registered in other areas of the industry, including the regulated distribution businesses. Again, this was most marked in the privatised systems in Victoria than in the government-owned systems. It seems likely that part of the reason for this is the closer commercial focus of private businesses. There is also some residue of political appointments to the corporatised businesses' boards. Ten years ago, the CEO of the largest of the NSW distribution businesses attempted a reorganisation to capture the same labor-saving gains as his counterparts in the Victorian privatised businesses. Its government-appointed board of directors responded by sacking him. This has become less frequent, though in November 2006, the NSW State Treasurer sacked the long-serving Chairman of the state's transmission business allegedly because he would not agree to an appointment of a politically favored director. (3)
Figure 8 illustrates the trends in terms of customers per employee.
Fig. 8. Distribution businesses: Customers per employee. Source: ESAA Electricity Gas Australia 2006.
3.4. NEW INVESTMENT OUTCOMES
Even though the competitive environment has meant low prices, windows have opened where firms have spotted (or thought they spotted) opportunities to expand. Though the presence of government-owned facilities may well be distorting new provision -- a point that is addressed later -- the market has, to date, not only produced lower prices but also resulted in capacity increases in line with demand. Table 2 shows new capacity.
Table 2. New capacity 2000–2006
| State | Capacity (MW) | Type | Ownership |
| Redbank | NSW | 150 | Coal | Private |
| Bairnsdale | Vic | 92 | Gas | Private |
| ValleyPower | Vic | 300 | Gas | Private |
| Somerton | Vic | 160 | Gas | Private |
| Laverton | Vic | 312 | Gas | Govt. |
| Loy Yang | Vic | 236 | Coal | Private |
| Oakey | Qld | 282 | Gas | Private |
| Millmerran | Qld | 852 | Coal | Private |
| Swanbank E | Qld | 360 | Gas | Govt. |
| Tarong N | Qld | 450 | Coal | Govt./private |
| Kogan Creek | Qld | 750 | Coal | Govt. |
| Braemar | Qld | 450 | Gas | Private |
| Hallett | SA | 220 | Gas | Private |
| Pelican Point | SA | 500 | Gas | Private |
| Ladbroke | SA | 80 | Gas | Private |
| Quarantine | SA | 100 | Gas | Private |
Source: ESAA, Electricity Gas Australia 2006.
In terms of average costs of new electricity increments on the eastern seaboard, coal is $35–$40/MWh and gas about $45 though this is based on a gas price that is at present less than half of that in the US. Capital costs are illustrated in Table 3.
Table 3. Capital costs of new plant
| Power station | Proponent | State | Cost in A$ million | MW | Cost in A$/kW | Type of plant | Fuel | Comments |
| Cockburn | Western Power | WA | 250 | 240 | 1042 | CCGT | Gas | Completed Nov 2003 |
| Braemar | ERM and Babcock Brown | Qld | 340 | 450 | 756 | OCGT | Gas | Unver construction |
| Kogan Creek | CS Energy | Qld | 1200 | 750 | 1600 | ST (dry cooled) | Coal | Under-construction (Includes coal mine development) |
| Kwinana Newgen | ERM and Babcock Brown | WA | 400 | 320 | 1250 | CCGT/ST | Gas | Under construction (Includes 160MW ST) |
| Laverton North | Snowy hydro | Vic | 150 | 320 | 469 | OCGT | Gas | Under construction |
| Kemerton | Transfield | WA | 250 | 260 | 962 | OCGT | Gas | Under construction (Includes gas connection) |
| Wagerup | Alinta | WA | 245 | 324 | 756 | OCGT | | Committed |
Source: ACiL Tasman for NEMMCO, October 2006.
For the CCGT plant, the cost $1000/kW to $1250/kW in 2006 represents a considerable increase from that which was estimated at under $900/kW in 2005. The increase is attributed to temporary cost increases in steel and other materials as a result of a surge in demand in China and India. For coal-based generation, a cost of about $1250 is indicated for Kogan Creek if there were no mine development costs.
3.5. THE DROUGHT OF 2007
Australia, a flat and dry place, has never had much hydro in its generation sector (less than 10% of energy production) and therefore its power prices were never considered sensitive to rainfall. The first months of 2007, however, proved that perception wrong. A severe drought affected the entire eastern seaboard and curtailed not only hydro generation, but also a number of inland coal-fired plants requiring cooling water.
The impact of this disturbance on spot and forward prices during early 2007 was quite dramatic, with both approximately doubling in a space of 3 months. This is easily explained in the energy-only market, as the withdrawal of "free" hydro and cheap coal energy must be replaced, even at offpeak times, with a more expensive gas turbine plant.
Understandably, there is some political repercussion, principally from advocates of those large customers who have to purchase new supply contracts. Fortunately, most customers, including small ones have contracted long-term well before the current situation, and, in turn, their retailers have contracted with generators. Thus, the political pressure is not overwhelming upon governments and regulators, who, at least as of May 2007, were not undermining the market.
At the same time, the water issue is very sharply biting into the profits of those generators affected by it. They are demonstrably taking on innovative responses, such as purchasing high-priced water, and investing in previously uneconomic conservation. All this is occurring without any regulatory intervention or "guiding hand", beyond the clear profit motive of such a high opportunity cost.
Figure 9 illustrates the price surge that had taken place.
Fig. 9. Flat forward price curve -- All regions. Source: AGL.
Forward prices from 2008 are starting to return to more normal levels, though they remain somewhat higher. This may be due to concerns that the current drought is part of a "global warming" pattern and uncertainty regarding future carbon taxes as well as some tightening in supply.
4. RELIABILITY AND CAPACITY REWARD
4.1. RELIABILITY -- ACTUAL PERFORMANCE
As seen in Table 2, considerable new capacity has come about since the market was conceived, roughly in parallel with the national growth in demand. (4) Previous over-supplies in New South Wales and Victoria have eroded, whilst previous under-supplies elsewhere have been remedied and, in Queensland's case, reversed.
Actual performance has been excellent in terms of "reliability", as the NEM defines it, meaning the overall adequacy of generation supply. (Load losses due to other causes, such as local distribution network interruptions or transmission stability problems are not avoidable through generation investment and therefore excluded.)
The first eight years of the NEM have seen the following percentages of demand interrupted due to lack of reliability:
- New South Wales, 0.0001%
- Queensland, 0%
- South Australia, 0.0025%
- Victoria, 0.0101%. (5)
In all cases, except Victoria, this would be considered a very successful reliability outcome for a first-world power system, and immaterial compared to typical local distribution outage losses of around 0.02%. The Victorian amount in turn is derived entirely from a power station strike in 2000. (6)
4.2. THE RELIABILITY STANDARD
A forward-looking reliability standard is used for the NEM based on a minimum level of projected reserves for the year ahead as defined by the Regulator. (7)
Where this standard is deemed to be breached in the short to medium term, NEMMCO is obliged to intervene in the market. As with other such interventions, this carries the potential, if used unwisely, to undermine the market reward function -- a matter discussed in Section 4.4.
To date, this power in Australia has been used sparingly, largely because the minimum reserve standard is softer than that in most other jurisdictions. The NEM's standard is an output-based standard: a measure of customer energy actually at risk. This is set at "an expectation of no more than 0.002% of energy unserved over time." It means that no more than 1 in every 50 000 light bulbs should go out due to generation shortfall. Or, to put it another way, customers will suffer, on average, no more than 10.5 minutes per year of interruption.
This compares with an average 100 minutes per year interruption in Australian suburbs due to local distribution faults. The requirement was created based on customer surveys which suggested the typical customer values reliability in the order of $20 000 to $30 000/MWh. (8) Considering the cost of providing peak generation capacity to meet the extreme peak of the demand shape, the cost of supplying the last 0.002% is actually greater than its customer value.
Using power system simulation to convert this unserved energy target to a deterministic reserve margin for a one in two years peak is equivalent to around 10–15% reserve margin.
The resultant standard compares with standards as high as 25% in many jurisdictions around the world, standards which, if worked backwards through the simulations, would mean that customers energy targets unserved are as low as 0.0002%, or about 1 minute in a year, and they are valuing reliability at $100 000/MWh? Kema Consulting (2005) notes that the Australian approach is at the low end of international standards.
Were those levels of forecast reliability demanded of the NEM, a much higher price cap would have been required. Indeed, it may be that any energy-only market will struggle to deliver those reserve margins, not because the energy-only market has failed a prerequisite, but that it is in fact simply correctly demonstrating that customers do not value reliability so highly.
4.3. THE PRICE CAP AND GENERATOR BIDDING FREEDOM
Discussion elsewhere in this chapter emphasises the need for a genuinely high price cap for an energy-only market like Australia. The notion of a price cap reflects the view that electricity has major differences from other markets in view of the instantaneous nature of the commodity, and the physical inability to link customers immediately to its price. Setting a price for such interventions is designed to allow a very large pain to those ill-prepared (and conversely a great opportunity for those who can help), but one that does not immediately result in a systemic financial collapse of market participants.
The current $10 000/MWh that has been in place since 2002 seems to be facilitating an adequate level of investment and relatively low customer prices. The price cap is reinforced by another mechanism, the "Cumulative Price Cap" which is set at $446/MW for an average of prices over a rolling week. Price is then capped at $50 offpeak and $100 peak. The rolling price cap has not been reached in the period since 1998 when the market commenced, though it has got close on a couple of occasions in situations which were not actually threatening the market's financial collapse, indicating that it is too low.
Whilst a generator market cap is defensible as a measure to prevent market financial collapse, if the objective is instead driven by consumer price protection, then the energy-only market is probably doomed as consumers or their agents will prefer to ride upon this much cheaper protection than invest in supply.
A market cap is always a departure from a pure market approach, and the lower is the cap, the more vulnerable the market becomes. In Australia's case the $10 000/MWh cap is considerably below most estimates of the Value of Lost Load (over $30 000/MWh.). Even so, it appears that prudent retailers seek to insure themselves to the very peaks of their forecast demand and generators invest well before any shortfall manifests itself. Retailers' apparently irrational prudence is driven by the fact that generators have the freedom to exercise their market power. Indeed, it is not uncommon for large portfolio generators to shadow the $10 000/MWh price cap for as much as 20% of their capacity and, therefore, high prices may occur well before actual interruption. What is even more impressive is that there is no legal or political sanction for this behavior, so it constitutes a genuine threat to those who expose themselves.
During 2001, a "good faith" rule was inserted into the market. This is purely a mechanism designed to prohibit intentional deception. In theory, in an energy-only market, a generator can confuse its competitors by changing its bids at the last minute. This rule prohibited last-minute changes where its own or market conditions were unchanged, but in no way does it attempt to limit their market power. Indeed, acceptable public reasons for last-minute bid changes include "change in market price/volume trade off." After three years of the rule being in place there have been no prosecutions under it.
4.4. CAPACITY REWARD AND INTERVENTION
Uncertainty about the adequacy of market remuneration has led to questions about the appropriate incentives to invest in new generation. These questions spawned several answers.
With the NEM as a pure energy-only market, reliability sufficient to satisfy the many stakeholders is a likely outcome. Of course, Australian governments are no less fearful than others of the unknown in relation to blackouts, and this adds a complicating set of regulatory factors. In the NEM, the regulatory responses are centered on the concept of Reserve Trader. This overrides the market supply when the market operator decides that there is insufficient supply forthcoming from the market in the foreseeable future. The problem, other than that of explaining how a public sector body is more likely than the market to predict supply and demand conditions, is that the Reserve Trader as a concept has internal inconsistencies.
If the public agency (called NEMMCO in Australia's case -- the market/system operator) considers there to be insufficient supply, it must contract for that supply. In doing so, it must either:
- move into the market and contract supply at a higher price than the supply was able to get from real customers; or
- build its own capacity.
In an attempt to avoid undermining the market, NEMMCO is limited to contracting for reserves no further than about six months ahead. Due to practical difficulties, this largely excludes new entrant generators. Thus, it is likely to only get mothballed supply or demand-side opportunities, and it will contract for this by providing a higher price than is available in the general market. While the consequential price increases may not be serious, they do raise costs to customers, thereby defeating the purpose of the market model.
More than this, the process will encourage firms or demand-side suppliers to hold back offering contracts to the market in the hope that the government will offer them a better price. While such data is confidential, it is likely that several customers contracted in this way during 2005 had previously participated in the market for a market-based return. This has a snowballing effect in creating even greater apparent shortages and can start a process that will unwind the market itself. An example of such an outcome has been reported by Joskow (2006): "In New England, the amount of generating capacity operating subject to special reliability contracts with the ISO has increased from about 500 Mw in 2002 to over 7000 Mw projected for 2005 (ISO-New England (2005), amounting to over 20% of peak demand." Such a proportion of the market subject to administration must start to undermine the commercial market as a whole.
If the reserve power agency were to hold its own capacity to be used only in special circumstances [e.g. when the price exceeds the spot market cap (VoLL) or an agreed period of time], this is simply an added insurance on VoLL and a drain on the market. Of course, if the reserve capacity were to be used more liberally than this it would undermine investment incentives and contribute to supply shortages in the future.
Another answer to capacity shortages is a capacity payment offered in addition to the energy price. Some incumbent Australian generators, dismayed at the very low prices they are seeing, favor this. Against this, it has to be recognised that if additional payments are made for supplying energy for one set of reasons, compensating reductions will occur with related payments as firms jockey for revenues that cover their costs. Moreover, experience has shown that where supply is ample, the capacity price will be bid down perhaps to negligible proportions. In this respect, Adib, Schubert, and Oren in Chapter 9 of this volume discuss what they call the "bipolar nature" of capacity markets with price being zero where capacity is ample and infinity where it is short. (9) Where there is already some market imperfection, as appears to have been the case in the original England and Wales market, the capacity payments may become high as firms use market power to bid them up.
A single price or the addition of a capacity charge as the most appropriate way forward must, however, remain one of the open questions in market design around the world. In California, the issue is being reviewed once again but the California Public Utilities Commission staff (2005) is very much in favor of a capacity charge. They argue that electricity is different because of its near-total demand inelasticity -- the inability to selectively supply people -- and thus have a differentiated reliability; and they note that a price cap, which they see as inevitable, also means less than ideal conditions for individual risk management.
This does not seem to be borne out by the experiences of the energy-only market that is in place in Australia. An energy-only approach appears to be superior to all the refinements that have been tried elsewhere. It places the onus on commercial parties to cover their future positions in the knowledge of their customer bases and future demand shifts. Suppliers and retailers develop their own reserve trader through contracting in ways that give them adequate insurance for mistakes and uncertainty. It has served the Australian market well in terms of incentives. New capacity in generation has kept pace with requirements.
Among the measures that have ensured the energy-only market operates successfully in Australia are a relatively high reserve price of $10 000/MWh, which places considerable pressure on retailers to forecast and balance demand accurately and to contract for their customers' future needs. This, in turn, provides incentives for generators to deliver the necessary capacity. Further assisting this is a relatively open and active retail market and relatively unimportant customer price caps (soon to disappear entirely). All major customers have been free to seek their own retail supplier for many years, and the household and small business consumers are likewise mainly freed from dependence on their original retailer.
4.5. THE ROLE OF THE ELECTRICITY RETAILER
4.5.1. Retail competition
A competitive retailing system is a bridge between the producer and the consumer and provides, by seeking out customer needs and arranging for their supply, important signals for new production and specific sorts of new production (electricity that is peak, offpeak, green, etc.). One (imperfect) measure of retail competition is the degree of customer churn.
According to Grey et al. (2005), in 2004, Great Britain, Victoria, and South Australia were the "hot" markets for retail switching, with only Texas in the US ranked in their next category, "active." Littlechild (10) estimated the numbers of residential customers with non-incumbent suppliers as ranging from 43% in the UK and 33% in Victoria to very low shares in US states other than Texas (where the share was 24%).
August 2006, data for Australia indicates that 67% of Victorian and 27% of NSW customers had switched from their host retailers. (11) Customers with a contract other than with their host retailer comprised 42% in Victoria and 18% in NSW. In South Australia, 64% of customers had shifted out of the default contract (there was only one original retailer) by the same date.
The lower level of "churn" in NSW is due to two factors. First, there is a mandatory insurance scheme for small loads. Though this is being discontinued it places out of state retailers in a less favorable position to hedge against risk since the intra-state retailers have a lower de facto peak price. In addition, the level of retail price cap bites earlier than in Victoria and South Australia, meaning that a larger proportion of residential buyers are, in effect, unable to obtain commercially a better deal than the government has mandated their retailer offers them. Another feature of the NSW arrangements is that consumers are able to return to a standard tariff, should they wish. Such fall-back tariffs offering a one way bet have unwound retail deregulation in a number of US jurisdictions.
Australia has seen the emergence of a number of new retailers, some of them very small, and in several cases their entry has been successful. There are concerns that full retail competition can bring instability where retailers have taken unreasonable risk and then left the market leaving other retailers to continue supplying their customers. This apparently occurred in Texas in 2003. (12)
The requirement of a retailer of last resort is certainly an area where public policy-making to protect the small consumer has the potential to unwind the proper forces of an energy-only market. The Australian pool mechanism demands of all retailers quite onerous credit assurance for both pool and networks. This has the potential to be inefficient, but can be overcome with voluntary settlement offsets with generators. The credit requirements place pressure on retailers to ensure that they are prepared for price volatility. This should mean that retailer bankruptcy is very unlikely, or that, rather than short-payment, it will be inability to get assurance that will lead to a retailer's forced exit -- which means it can be managed more effectively and the customer accounts are likely to be sold to a willing, and more prudent, buyer.
In the event that a retailer becomes bankrupt, Australia has a retailer of last resort for smaller customers who comprise half the market. The liability is on foundation "host" retailers to absorb these customers. The actual arrangements vary between the states. In Victoria, the government allows the host to immediately replace their tariffs with a much higher price than the typical competitive level (10–20%).
In some respects a last resort retailer fulfilling contracts of a failed competitor is not different from many other industries. For example, airlines will usually take up emergency cases of stranded passengers when a carrier goes bankrupt and ceases to operate.
4.5.2. Retailers as drivers of efficiency
As retail margins are only about 5% of cost, some are perplexed by the prominent role given to the retailer in the judgments about the liberalisation of markets and, implicitly, about how they correspond to consumer benefit. A major push at one time was to have tariffs set on a "pass-through" basis. However, retailers focused on customers and suppliers in a competitive situation ensure a sound alignment between the two. Competition is, fundamentally, a discovery process, whereby the competitors set out to ascertain the needs of customers, where those needs are not well defined by the customers themselves.
Evidence of such poor alignment in the centralised system can be seen with the excessive priority on base-load seen throughout Australia, which led to a major surge in new peaking capacity once competition was in place. This has meant a bonus of much better reliability at lower cost. Competitive markets provide particularly strong incentives on retailers to search out the lowest-cost supplies and match these with customer demands. This is particularly so in Australia's case where the wholesale cost of electricity can rise to $10/kW hour compared to its normal price of about 4 cents per kW hour.
With a "pass-through"-regulated tariff retailers would gain no benefit in seeking innovative and highly competitive supply contracts. The economic benefit of such innovation would simply pass to the customer whilst the implicit costs, such as greater risk, would fall on the retailer. The only incentives such a retailer faces to attain efficient supply would be artificial ones set by the regulator of the pass-through process. These would always be out of date, out of touch with the customer and conservative.
One outcome would be that retailers supplying customers who may have a more peaky demand profile would not have an incentive to find suppliers who are the most efficient supplier of such a load shape. They would also be indifferent in seeking out such customers rather than others with flatter load profiles. The associated suppression of cost-reflective price variations is likely to rebound on the efficiency of the entire investment chain, including the highly capital-intensive sectors.
Retail competition also offers other benefits. For example, it facilitates a variety of different product offerings. Among these have been "green" power packages, obtainable by those prepared to pay a premium for this form of electricity supply. It also reveals the extent of the voluntary demand for such products.
Competitive retailing has also meant experimentation with new marketing tools. Victorian retailers have successfully experimented with direct debiting of customers' accounts and there have been experiments in combining energy with other retail activities.
There are clear dangers in overriding the forces of competition, dangers that intensify with the length of time the controls remain. For retailers themselves, setting prices too low will require cross-subsidies. Aside form their general inefficiencies, these will bring about an unraveling of the market balance because it will prove increasingly difficult for the regulators to set flexible prices which are cost-reflective and do not leave the retailer in a revenue deficit.
Financial distress among retailers ensuing from such price caps is likely to be an early manifestation of an impending crisis perhaps culminating in California-style collapse. This aside, the price suppression involved in regulation distorts the signals for augmentation in new generation. At best, this will bring inefficient balances between peak and offpeak and at worst, it will lead to supply inadequacies.
Many are keen to see "smart" meters being installed to allow time-of-day measuring of power use by small consumers who account for half of the load. This would allow pricing for those using air-conditioners during peak hours to match the higher supply costs involved. It would drive peak load reductions and correspondingly lower charges to other customers. The overall benefit of this turns on the potential cost saving against the installation costs of the meters themselves. These sorts of metering have not been very successful in facilitating load shaving in the large business markets which have long had the metrology and controls to facilitate this. Experience suggests that regulatory interventions to force the pace of change should be subjected to critical assessment.
5. SOME KEY ISSUES AND FRAGILITIES
5.1. GLOBAL WARMING AND NEW GENERATION
Australia has perhaps the cheapest primary energy in the world available in major quantities. Coal from Queensland and parts of NSW is abundantly available for conversion into electricity at $40/MWh virtually forever. Brown coal in Victoria is available at a similar price. These prices are less than a half of those in Japan and considerably below those of the EU and most of the US. Coal at $40 is half the price of wind energy (the costs of which are flattered by its inherent unreliability) and the cheapest nuclear option is about 30% dearer including the (relatively low) disposal costs. Figure 10 illustrates costs.
Fig. 10. Electricity costs. Source: Authors based on several sources.
A greenhouse tax would be a great equaliser. Figure 11 illustrates the costs with a carbon tax or tradeable right set at the Stern Report's (2006) $A130 per tonne of CO2.
Fig. 11. Costs of different electricity sources.
With such an imposition, natural gas becomes a bit cheaper than coal, though this might be offset by a rise in its price, which in Australia is less than half that of the US.
The big movers (or stayers) are nuclear and wind. Wind on the assumptions given becomes cheaper than coal in Victoria and NSW, though its role can never be to supply more than about 10% of the load at almost any conceivable price and with the most heroic assumptions on future improvements.
Nuclear though assumes the leading position. Uranium is relatively abundant and comprises only a small share of costs, the bulk of costs coming for plant. Doubtless, these costs are also inflated by over-engineering to cater for hysteria over safety matters. This, and the fact that relatively few new nuclear plants have been built in recent years, means that the price might even be reduced below the levels indicated by current studies.
So in a carbon-constrained world, there is a means of abundant and reliable electricity supply that will allow existing consumption at only a modest increase in costs. However, even this is insufficient to provide the emission savings of 60% or so sought by the Stern Report.
Moreover, Australia has no advantage in nuclear. Australia's advantage is in cheap fossil fuel-based energy. Abandoning that advantage, even progressively, will not only mean far higher capital costs but also elimination of the nation's comparative advantage in energy-intensive industries. It will, therefore, at a minimum, entail a considerable industrial restructuring.
Moving to the prospect of an energy tax or a tradable right to emit introduces a considerable uncertainty in new plant development. It is notable that the new large-scale base-load coal plants in recent years have been built by government entities; hence, the government is taking the regulatory risk of some ex post facto new imposition. Greenhouse mitigating activity does infer some additional commercial risk, which may add yet a further uncertainty about future supplies.
5.2. GOVERNMENT OWNERSHIP
Over half of Australian electricity generation capacity is in government hands. Although all government generation businesses operate under normal company law with directors that are independent, the fact that the directors are appointed by the state governments gives rise for some concerns regarding their independence from political processes.
In NSW, there are suggestions that the government generators are restrained from major new investments by a government conscious of previous excesses in development.
It has been suggested that the opposite problem prevails in Queensland, the state with the fastest-expanding load. In the ten years from 1990, the state built only one major power station and its precarious balance of supply and demand was immediately revealed once the electricity market went live during 1998. Shortages that had been hidden were immediately reflected in wholesale prices that were double those of the southern states.
Remedying this was essential. And since Queensland, along with parts of NSW, probably has the lowest-cost abundant quantities of coal in the world, remedying this was straightforward. Over the six years to the end of 2006, Queensland increased its electricity generating capacity by a quarter, adding 3300 MW, 60% of the new capacity within the Australian National Electricity Market.
As part of its initial catch-up in capacity, the government encouraged private investment to enter the market. A Shell-dominated consortium built the 850-MW Millmerran power station in 2002. That consortium also took a half share with the government's CS Energy in the 920-MW Callide C station that was completed a year earlier. The 450-MW Tarong North, started in 2000 and completed in 2003, also had a mixture of government and private funding. A further government-owned major major station was announced in May 2004.
Soon after entering the market, Shell clearly felt its investment had turned sour and steadily sold down its interest. The final one-quarter share went for $US226 million in December 2003 to China Huaneng Group. Perhaps the Chinese bought well, but the transaction valued investments that had cost some $2.2 billion at only $1.2 billion.
In this respect, the danger is that investments undertaken on non-commercial terms using government funds will undermine all investments. Private sector businesses argue that the Queensland government, having enticed investment into base-load power, has then accepted non-commercial rates of return from the power stations it owns.
Some credibility to this claim has been given by statements by the Queensland Energy Minister that he sleeps easier if he has 25% surplus generation capacity. However, a corollary of such a supply margin is a collapse in prices and in the value of assets. Although there are relatively robust transmission links between Queensland and New South Wales, the NEM state to the south, spot prices in Queensland have been 30% lower. And prices in NSW were themselves considerably reduced by the export of surplus power from Queensland.
Even so, the higher prices in NSW have encouraged the Queensland government to seek an augmentation of transmission capacity to take advantage of those prices. But state-owned NSW generators see their market as already being infected by surplus Queensland capacity and low prices from oversupply. If there is a loss of profits by private investors caused by government accepting sub-commercial rates of investment return, this risks creating a vicious circle under which all future investments will be state funded.
5.3. ENSURING ADEQUATE TRANSMISSION CAPACITY
Among the most contentious issues have been and remain the ability to supply the right amount of transmission capacity. Many have argued that transmission should be provided without the need for this to be fully commercial in the sense normally required of interventions throughout the economy. In this respect, positions have changed little over the past decade. Thus Hogan (1998), although injecting a market-type mechanism into transmission provision, saw that "Grid expansion and pricing would continue to present a need for regulatory oversight, but the existence of workable transmission congestion contracts would substantially simplify transmission investment decisions." (p. 28.)
In Australia, London Economics (1999) argued that short-run congestion could recover at most 25% of transmission costs and, by inference, transmission must be supplied on a regulated basis with mandatory charges. L.E. estimated recovery in US markets was 5–20% of costs, with the highest level of recovery they could identify being Queensland at 24%.
Similarly, the US National Energy Policy document of May 2001 argued that, "The transmission system is the highway system for interstate commerce in electricity. Transmission allows the sale of electricity between regions. In a particular region, transmission can be a substitute for generation, allowing that region to import power that otherwise would have to be generated within that region." But while it recognised the importance of incentives to augment the transmission system, it saw these as being rate- based with a regulatory backbone and did not contemplate the implications of this for its substitute, generation, and the consequent market distortions.
Attempts to place transmission provision on the same basis as generation has proven difficult. Australia's experiments with merchant transmission have not been successful. The new entrant Transenergie (13) has now opted for regulated status of its lines and sold out of Australia. This may reflect the intrinsic inability of such facilities to earn sufficient return because of lumpiness and externality issues. Others would argue that such matters are equally prevalent in power stations: they are normally too large for their immediate requirements.
With regard to externalities, it is argued that these are too great to allow profitable merchant transmission, because the benefits of lower prices (actually arbitraged prices) accrue to all and not only to those paying for the asset. This has spurred proposals to reward new transmission investors from gains made by consumers (see for example, Haydon and Michaels, 2006). However, the effect of transmission augmentation is not markedly different from the situation concerning a new generation facility that will tend to suppress the price of all delivered electricity in its interconnected region. Few would argue that by analogy, all generation should, therefore, be government-owned or subsidised, even though many argue for a form of general overhead support in the form of capacity payments. The fact is that supply across the economy is seldom unaccompanied by some externalities.
If transmission is provided free or at regulated prices, this may discourage a more rational and lower cost development of new generation. The tradeoff between nearby and remote generation (via transmission) is uniquely critical for Australia, where distances between load centers and therefore the cost of transmission are very large, and fossil fuel sources are relatively inexpensive and quite widespread.
The danger is that links which are financed by a compulsory charge on the customer might lead to incentives to site generation in places that are distant from major markets. If someone else is paying for transmission, the rational generation business will be indifferent to its costs, thus distorting the efficient tradeoff transmission costs and generation costs.
Associated with the claim, that transmission would be inadequately provided in the absence of it being made subject to regulated support, is the contention that a transmission line has market power and its prices should be regulated. However, for the most part, transmission inter-ties or interconnects offer no more market power than that of a significant generator portfolio. Inter-ties in Australia can account for some 35% of supply (Victoria to South Australia) but normally provide much less than this. Their market power is confined to influence over those wishing to export, and such firms are normally capable of writing contracts to cover any vulnerabilities they foresee.
How best to allow expansion of transmission, especially in terms of the regional linkages, has been the subject of a heated debate in Australia. An uneasy compromise is presently in place for transmission under which regulated links will be permitted as long as a net market benefit is judged by the regulator to be the outcome and as long as the proposed link is the best of a range of feasible alternatives. This, however, remains dissimilar from the decision-making structure that is seen in the generation sector or in markets more generally, since it may incorporate some to the network benefit externalities which a comparable investment in a new generator would not capture.
The competing solutions that generation and transmission often offer mean disputes about the merits of a new transmission solution are likely to remain. These are illustrated by pressures from the Queensland government to augment transmission links following the state's capacity increases driving down prices below those in NSW. This might be regarded by others as facilitating dumping by having expanded capacity financed as a regulated link because most of the costs fall directly on consumers.
As Michaels (2006) argues, establishing a market in a condition of supply surplus is a relatively straightforward matter. Ensuring its ongoing development requires an appropriate structure. Michaels regards the separation of transmission and generation as potentially fatal. He says:
Studies in the 1980s and 1990s almost invariably concluded that vertical integration produced efficiencies that would be lost in a breakup. These economies of integration applied to both the generation-transmission interface and to the ownership of generators and fuel supplies. This scholarship was almost totally forgotten as California and other states began to restructure their power industries in the mid-1990s.
The matter of establishing an appropriate regime for transmission development is again being considered before the Australian Energy Market Commission (AEMC). The AEMC recognises that investments may be inappropriately located because of the charging approach. It favors prices being set on the basis of short-run marginal costs, which it argues is supported by economic theory and competitive market experience.
This is subject to a great many caveats. Importantly, prices set on the basis of marginal costs are not found in many markets -- they are characteristic of markets under stress (for example, where there are few suppliers engaged in a "price war") or facing long-term decline (so that sunk costs need not be recouped). Even the market for highly perishable goods like vegetables seldom sees produce offered at marginal cost and only then is this seen at the end of the trading day.
The AEMC recognises that if charges are set to meet short-run marginal costs and there is spare capacity, consumers may locate too far away from generation, especially if reliability standards are in place to fortify the initial decision.
It considers that prices based on long-run marginal costs may lead to inefficient bypass. This leads it to support the notion of efficient discounts being offered which may be recouped by de facto surcharges on other customers. It is likely that the conditions under which these would be permitted would be accompanied by protracted and heated negotiations.
The practise in Australia is to charge the customers for the transmission use, rather than generators. Generators, however, do not have a property right to the transmission to the major hub. This means that a new generator with costs and a consequent bidding strategy lower than that of an incumbent generator would force the latter off the line once it was at full capacity. This might mean an alternative supplier with a higher total cost (including transmission costs to the major node) would replace the incumbent generator. This is demonstrated in Fig. 12.
Fig. 12. Illustration of Four Generators and Two Transmission Lines Serving a Load.
If generator B locates next to generator A, the latter is constrained out and replaced by the higher-cost generator C. Costs are $1000 higher. Generators A or B may have incentives to build additional transmission capacity but only if they can be assured of some exclusivity or some priority in its use. A customer coalition would also be willing to finance such an investment but the transmission business may face no such incentive, while generators B, C, and D would prefer the augmentation not take place since they are beneficiaries of the higher price set by generator C. Allocation of a form of property right would bring about the optimal investment without the rancor of a series of bureaucratic hearings and extensive lobbying.
A new generation unit or an expansion of an existing unit should be required to pay for any augmentation needed to allow its power to be transmitted. This, implicit in which is some form of nodal pricing, gives a better market signal than if the determination is left to a regulator or to a transmission business since it allows the transposition of commercial forces for those that are actually or mainly controlled. As AGL (2005) argued, "Applying deep connection charging to generators at the time of connection would allow the network costs to be included in their decision process on location and allow for appropriate development of networks to efficiently transfer power from generators to customers."
With rights over their current levels of service, existing generators have options about augmentation that ensure the full costs of their decisions are taken into account. They may also downsize by selling part of their carriage rights to a new player, thereby avoiding wasteful duplication of capital.
This is a means of applying a market solution based on a form of property right to the creation of new transmission capacity. It can, if it proves to be practical, resolve the provision of new capacity by taking it away from the artificial markets that regulators construct in permitting new transmission and levying consumers accordingly. In that way a similar driver is put in place to that of new generation provision and, in principle, a more consistent set of investment incentives are established, thereby avoiding waste and gaming of the regulatory system.
6. CONCLUSIONS
Australia, like the UK, has evolved a market with very little regulation and, importantly, wholesale price caps that are either absent (in the case of the UK) or relatively high (in the case of Australia). Even with market interventions, the outcome has been very satisfactory in terms of serving consumer demand and ensuring resource adequacy. In Australia's case, those interventions include consumer price caps (diminishing in importance and soon to disappear); a Reserve Trader (sparingly used and never having made any difference in the event); mandatory generator/retail contract hedges in NSW (a semi-protectionist device which is soon to be abolished), and the commercial risks of government owning almost half of generation (though corporatisation of their boards means they no longer are pure political instruments).
Many are concerned about market abuse. The more independent suppliers there are, the better this is avoided, but even so abuse is not important -- indeed, it is necessary in thin markets like Australia's. Almost all generators in Australia bid some part of their capacity at very high prices. If they set the price at $9000 they would be delighted, but the importance of this is muted by the fact that 95%+ of supply is contracted. And in overall terms, the high-price excursions that have occurred have still left average prices low. Some are concerned that generators have lost a great deal of money in some deregulated markets like Australia. But some firms have thrived in the electricity generation market; and if none have this, it indicates a need for a rise in the risk premium and the price, and the market will itself correct for the inadequate profit as long as there is open entry.
Occasional high-price excursions are important in reinforcing the need to contract. In Australia, there are some requirements on generators to explain their re-bids but they are cursory and really there to prevent a maverick generator purposefully trying to undermine confidence in the bidding program by constant changes aimed at pure deception. As in all markets the insurance against "abuse" is competition. If there are pockets where high prices can be manipulated, this has its own profit-oriented correction factor unless it is government induced, in which case there is a more straightforward deregulatory solution.
Equally important to a competitive generation supply is a competitive retail market. Retailers in the electricity market are always likely to confront consumers requiring the product at will and at a known price. With smart metering, some price-induced demand shaving will be increasingly possible at the household level but quantities becoming available are always likely to disappoint -- after all, smart metering and controls have been in place with large users but seldom activated. Electricity is not sufficiently costly to trigger major changes in behavior, and the suggested elasticities (-0.2) would probably not be achieved in the short term even if full knowledge of costs were available.
For the retailer, the main game is likely to remain forecasting his customers' demand and arranging for supplies to be made available through an array of contractual mechanisms. Not only is the retailer a crucial link in bringing together supply and consumer demand but the retailer's exposure to price volatility forces it to adopt very prudent contracting strategies. A retailer going bare and relying on the spot is engaged in extremely risky business since in the price ramping-up process prior to a blackout caused by insufficient capacity, that retailer will go broke. Not only does this concentrate the mind of the retailer itself, but its creditors add a further discipline. The retailer's creditors, conscious of their own exposure, are constantly viewing its books and ensuring their interests are protected as conditions of maintaining and extending loans.
The consequent risk-aversion of competitive retailers is one reason why there need be little concern about the emergence of "gentailers" because retail arms would not favor their generator affiliates. Should they do so, they would be to jeopardise supplies from other generators.
The more significant concerns are about the interface of transmission and generation where one is market-provided and the other is centrally determined. No market has yet devised a practical means of marrying the two components of supply in a market-driven context. Australia's Electricity Code, in principle, requires new generators to ensure that they have adequate transmission but, in practise, transmission remains regulated. We have outlined a means of moving to a market-oriented solution.
REFERENCES
Australian Energy Market Commission (2006). Annual Electricity Market Performance Review: Reliability and Security.
AGL (2005). Electricity Transmission Revenue and Pricing Rules Review: Issues paper on transmission revenue requirements, October.
Boiteux, M.P. (1949). La tarification des demandes en pointe: Application de la théorie de la vente au coût marginal. Revue générale de l‘électricité, 58, 321–40. Translated as "Peak load pricing". Journal of Business 33, 157–79.
Bushnell, J.B. and Wolfram, C. (2005). Ownership change, incentives and plant efficiency: The divestiture of U.S. electric generation plants., Center for Study of Energy Markets.
California Public Utilities Commission (2005). Capacity Markets White Paper.
Caramanis, M.C. (1982). Investment decisions and long-term planning under electricity spot pricing. IEEE Trans. Pow. App. and Sys., 101, 4640–8.
Chao, H-P. (1983). Peak load pricing and capacity planning with demand and supply uncertainty. Bell J. Econ., 14, 179–90.
Cramton, P. and Stoft, S. (2006). The Convergence of Market Designs for Adequate Generating Capacity with Special Attention to the CAISO's Resource Adequacy Problem, A White Paper for the Electricity Oversight Board, p. 30.
Fabrizio, K. M., Rose, N.L., and Wolfram, C. (2004). Does competition reduce costs? assessing the impact of regulatory restructuring on U.S. electric generation efficiency. Center for Study of Energy Markets.
Grey, P., Lewis, P., and Griffin, J. (2005). Peace/Vaasaemg: Utility customer switching research report. World Retail Energy Market Rankings.
Haydon, J.J. and Michaels R.J. (2006). Merchant transmission redux. Pub. Util. Fort., September, 58–61.
Hogan, W.W. (1988). Transmission investment and competitive electricity markets. Center for Business and Government, John F Kennedy School of Government, Harvard University, April.
Industry Commission (1991). Report into Electricity.
Tasman Institute (1991). Report on Victorian Electricity Corporatisation and Privatisation.
Joskow, P. (2006). Markets for power in the United States: An interim assessment. The Energ.J., 27(1), 1–36.
KEMA Consulting (2005). Review of Methodology and Assumptions Used in NEMMCO 2003/04 Minimum Reserve Level Assessment. NEMMCO.
Littlechild, S. (2005). Beyond regulation. Beesley Lectures on Regulation, Institute of Economic Affairs, London.
London Economics (1999). Report for the ACCC, April.
Michaels, R.J. (2006). Vertical integration and the restructuring of the U.S. electricity industry. Pol. Anal., 572, 20.
National Audit Office (2003). The New Electricity Trading Arrangements in England and Wales.
National Energy Policy Development Group (2001). Reliable, Affordable, and Environmentally Sound Energy for America's Future.
Newbery, D.M. and Pollitt, M.G. (1997). The restructuring and privatisation of the CEGB -- was it worth it?. J. Ind. Econ., 45(3), 269–303.
Oren, S.S. (2000). Capacity payments and supply adequacy in competitive electricity markets. VII Symposium of Specialists in Electric Operational and Expansion Planning, Curitiba, Brazil, 21–26 May.
Report by the Independent Committee of Inquiry (1993) (the "Hilmer Report") National Competition Policy.
Roques, F.A., Newbery, D.M., and Nuttall, W.J. (2005). Investment incentives and electricity market design: The British experience. Rev. of Net. Econ., 4(2), 93–128.
Simshauser, P. (2006). The conditions necessary for the microeconomic reform of a power, generation industry. Econ. Pol. and Anal., 34(2).
Stern, N., Peters, S., Bakhshi, V., et al. (2006). Stern Review: The economics of climate change, HM Treasury, 239.
Stoft, S.E. (2002). Power System Economics: Designing Markets for Electricity. Piscataway (NJ): IEEE Press.
Victorian Energy Networks Corporation (2002). Value of Customer Reliability Report.
ENDNOTES
1. Note that the NEM covers all the interconnected Australian grid. Western Australia and Northern Territory are not part of the NEM due to their remote location.
2. See for example, National Audit Office (2003). The New Electricity Trading Arrangements in England and Wales
3. Salusinszki, I. (2006). Sacked for rejecting union mate. Australian, 16 November.
4. Peak demand has grown by 4510 MW and supply by 5138 MW from 2000–6. See Australian Energy Market Commission (2006). Annual Electricity Market Performance Review: Reliability And Security.
5. Australian Energy Market Commission (2006). Annual Electricity Market Performance Review: Reliability And Security.
6. Interestingly, while strikes in the power industry commonly afflicted Victoria pre-market, the strike in the early days of the market was caused by a legacy of that culture and has not been since repeated –arguably, an outcome of the clear financial incentives upon generator performance created by the market.
7. The NEM's reliability standard is set by the "Reliability Panel", an independent body with broad membership and expertise. But it also accidentally benefited from first being implemented at a time of turmoil, where the government businesses were being divided up and vested interests were unclear, allowing something of a free reign to economic technocrats. This may explain why it is at a more moderate level than that demanded in some other markets.
8. See documents such as Victorian Energy Networks Corporation (2002). Value of Customer Reliability Report.
9. Adib, Schubert, and Oren also develop a procedure for a capacity payment mechanism where the energy-only market might not operate (because of price caps and other regulatory interventions). The authors see their proposals as a transition to a more comprehensive energy market.
10. Littlechild, S. (2005). Beyond regulation, Beesley Lectures on Regulation, Institute of Economic Affairs, London.
11. This may contain an element of double counting since it includes customers who have switched more than once; on the other hand, it excludes customers who have moved off the default tariff but remained with their existing retailers.
12. Personal communication Shmuel Oren, January 2007.
13. A subsidiary of Hydro Quebec.








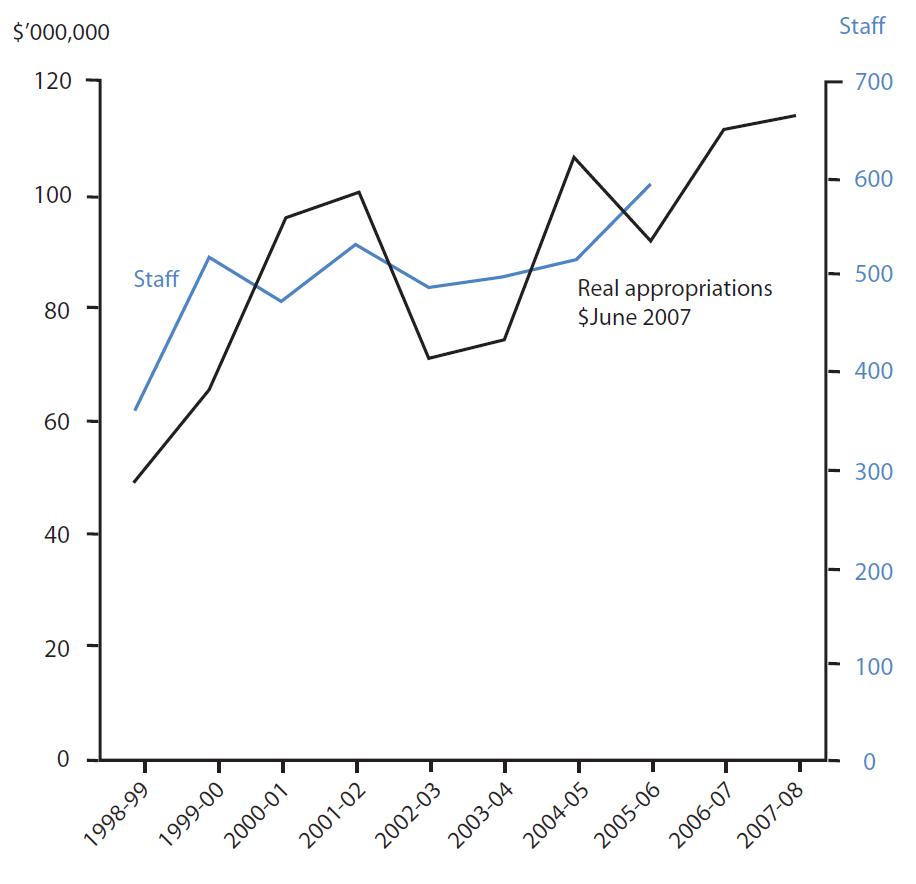
 Source: UBS (Union Bank of Switzerland), 2006.