Submission to the Productivity Commission
THE AMBIT OF THIS SUBMISSION
GENERAL TRENDS IN THE GROWTH OF REGULATION
Regulation can lead to considerable cost increases if it results in market distortion; its costs are small if the regulators chance on a price and service mix that corresponds to that which the market would deliver. US studies have rigorously documented the costs of regulation across all industries and have shown the outcomes of regulatory intervention vary markedly between industries and by type of regulation. (1)
In October 1977, the US Commission on Federal Paperwork concluded that the total cost of Federal paperwork involved a paperburden on the private sector of about half of that spent by government bodies themselves. This paper's analysis focuses on these paperburden costs of regulation rather than the potentially much greater costs stemming from regulations distorting business decisions.
The number of regulations and the paperburden costs they impose have steadily risen over the years. The following chart shows the trend of estimated paperburden hours on the private sector in the US.
Chart 1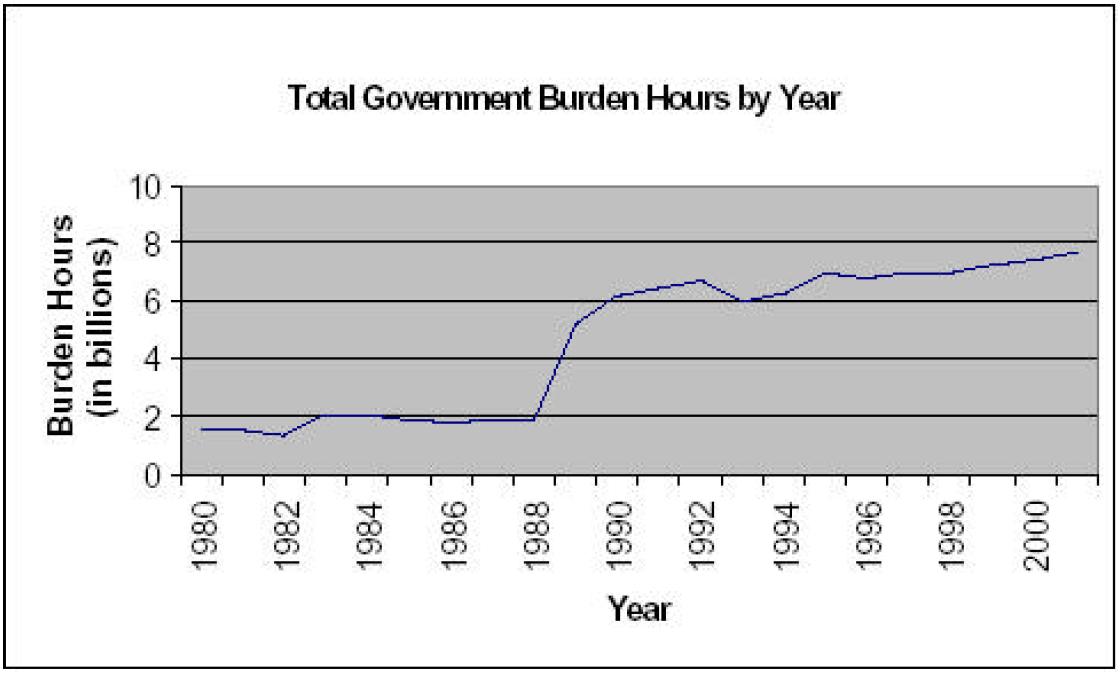
Although Australia has no data which tracks these trends systematically, it is unlikely that this country has avoided similar growth in the regulatory burden.
REGULATION OF THE AUSTRALIAN GAS INDUSTRY
In the case of the Australian gas industry, there is the potential for considerable misallocation of resources as a result of artificially low prices being required. The most controversial current issues concern gas transmission where, for Dampier supplied Perth and Moomba supplied Sydney, the regulatory authorities set prices that the infrastructure owners consider to be some 20 per cent below those required for an adequate return on the resources dedicated to the activities. The Commonwealth Minister appears to have overridden the regulator's price stipulation for the Moomba to Sydney Pipeline by removing most of the pipeline from regulatory coverage.
Incorrect estimates of the appropriate price by regulatory authorities can bring severe adverse repercussions on future investment and industry health. We have submitted our views on how best to avoid such losses in the future. (2) These involve the authorities exiting the regulatory arena wherever rival pipelines have emerged and not to engage in regulation where the market is not presently supplied (the "Greenfield" situation). The Commonwealth Minister appears to have come to a similar view with regard to the Moomba to Sydney Pipeline, which is supplying a market subject to workable competition in view of the Duke Pipeline from the Bass Strait.
Removing regulation from distribution is more difficult since this an industry segment is likely to remain predominantly a "natural monopoly" and to be more or less permanently subject to regulatory oversight. A less intrusive regulatory approach, more akin to the CPI-X reference price regulation originally envisaged, would be helpful in this respect. Regulated businesses have already had excess cost-padding removed, having been subject to considerable "building block" cost assessment in previous regulatory rounds. Shifting to price setting on the basis of economy-wide price changes would reduce the regulatory costs of both firms and the authorities.
For the other parts of the industry -- gas well-head supply or (in the case of electricity) generation and retail activity -- there is no regulation. As price and service in these sectors is determined by supply and demand, regulation would bring supply failure risks by restraining prices and hence investment.
This paper gathers together the costs of energy providers' responding to the requirements of "economic" regulation. Because gas and electricity industries are increasingly converging, the findings encompass both industries.
Not only do the costs this paper estimates exclude the wider cost repercussions involved in investment and other activity changes stemming from regulation but also excludes paperburden costs from other regulatory controls. These include those specific to the industry, like gas safety and tree clearing, and those that have a wider application like occupational health, environmental issues, welfare and planning. The present submission therefore complements our earlier submission and rounds off material previously provided to the Commission (and appended as Attachment 1 to this submission) on the government-incurred costs of regulatory resources.
APPROACH TO ESTIMATING THE INDUSTRY'S PAPERBURDEN COSTS
We obtained the cooperation of the ESAA and the AGA to circulate a questionnaire to the member firms of these two associations. Information was sought on:
- The number and cost of employees (including overhead) involved in the specified type of regulation
- The allocation of those employees' time between different activities including wholesale and retail markets, and generation, transmission and distribution/retail
- The consultants and other external resources that were engaged over the previous year
- Costs involved in licence fees
Questionnaires were sent to some 60 different firms within the gas and electricity industries. Twenty firms responded. In terms of the size of the firms, compared to the aggregate size of the industries the firms covered
- 34 per cent of generation capacity
- 10 per cent of transmission
- 58 per cent of distribution/retailing
The sample size therefore covered some 40 per cent of the gas and electricity industries. The respondents also comprised a reasonable spread of large and small entities and we feel comfortable in extrapolating the results to the sector at large.
However we would place caveats on the numbers we have estimated.
- We are uncertain about whether firms have included all resources in their responses. Regulation for some sectors looms so large as a determinant of profits -- even survival -- that its administration sometimes pervades the whole organisation. Respondents may be understating the roles of "line" departments in their estimates of aggregate resources within the firm.
- It is seldom possible to obtain material that covers a typical year. That sought in our questionnaire covered the past 12 months. For the most part, this was a period between reviews, especially for the distribution businesses and may not reflect the position in other years.
SURVEY FINDINGS
ELECTRICITY AND GAS SUPPLYING FIRMS' REGULATORY COMPLIANCE COSTS
Overall Administrative Costs
Adjusted for the size of the sample the total annual direct cost of regulation in terms of employees and consultants for the generation, distribution and transmission sectors is estimated to be over $88 million. A little over half the costs were incurred by firms inhouse with the rest due to consultants.
Chart 2
Placed in the perspective of aggregate industry expenditures, the $88 million annual paperburden costs of the suppliers to the Australian gas and electricity markets is around 0.5 per cent of the sector's total expenditure of $18 billion.
Employee Costs
The in-house costs of $48.5 million cover wages and overhead expenses for an estimated 259 direct company employees who are involved in regulatory activities. The 259 regulatory compliance personnel directly employed is a little over half of the estimated 462 people employed in regulatory activities in government (See attached report). (3)
Perhaps coincidentally, this proportion of regulatees to regulators is consistent with the sort of proportion of economy-wide regulatory personnel to regulators estimated by the 1977 Commission on Federal Paperwork which drew upon information assembled by the US Office of Management and Budget.
External Advisors
The outside consultants firms hire include legal, economic, and financial advisors. These cost around $38,928,000 in the survey year. Legal advisors, who are hired by 89 per cent of companies, are the most common type of expertise used with economic consultants close behind.
Below are the percentages of firms hiring each type of outside advisor:
| Legal advisors | 89% |
| Economic consultants | 84% |
| Accounting/financial advisors | 53% |
| Other | 47% |
COMPARING THE DIFFERENT SECTORS WITHIN THE ENERGY INDUSTRY
Relative Importance of Regulatory Expenditures by Sector
The distribution and retail sectors employ the greatest number of regulatory compliance personnel at 158 people while the generation and transmission industries employ 45 and 55 people respectively.
Adding the in-house and external expenditures together, almost 50 per cent of the money spent on regulation costs in the energy industry is accounted for by the distribution and retail sector. Distribution and retail companies spend around $41 million, with transmission companies at $34 million and generation companies at $13 million.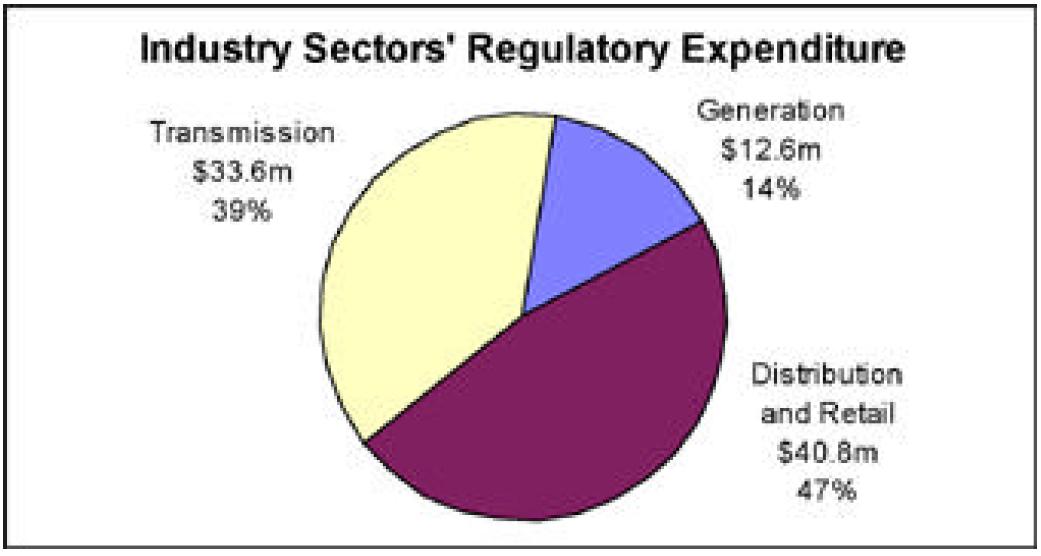
Internal vs. External Spending Patterns
The three sectors had different spending patterns between internal and external costs.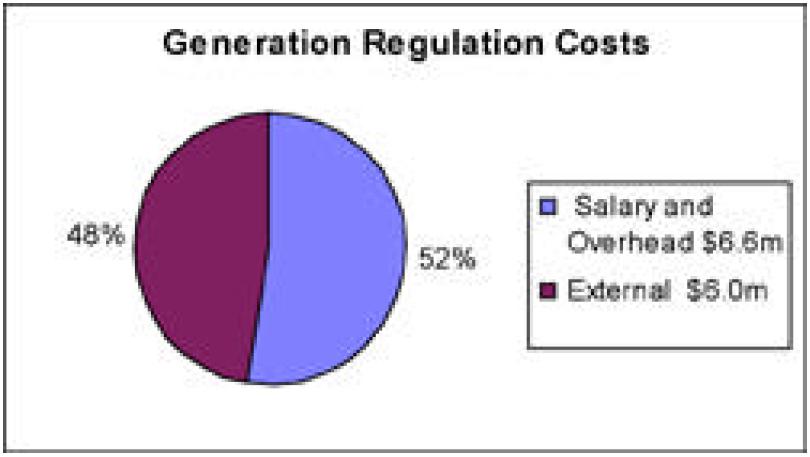
Generation companies incurred the lowest regulation costs, with only 14 per cent of the total expenditures of the market on regulation. This compares to their share in total revenues of about 45 per cent. These companies devoted about an equal amount to internal and external costs.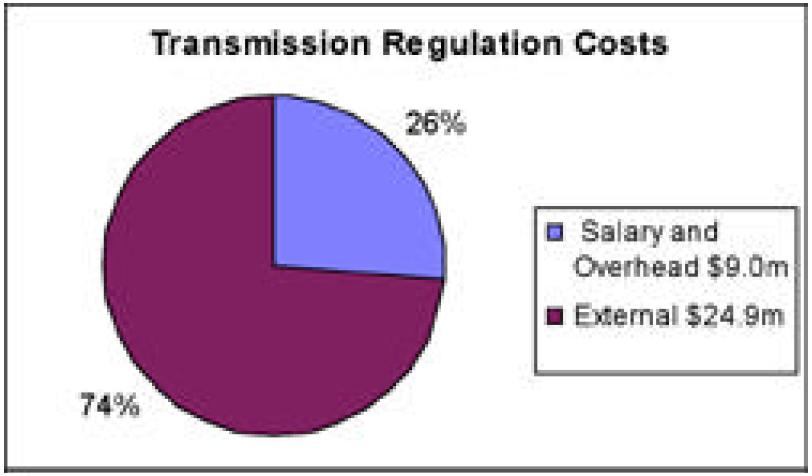
Transmission companies, which account for about 8 per cent of market revenues, accounted for 39 per cent of spending on regulation. They also allocated almost three times as much money to external advisors as to internal support. This pattern and magnitude of spending was doubtless influenced by the regulatory reviews underway.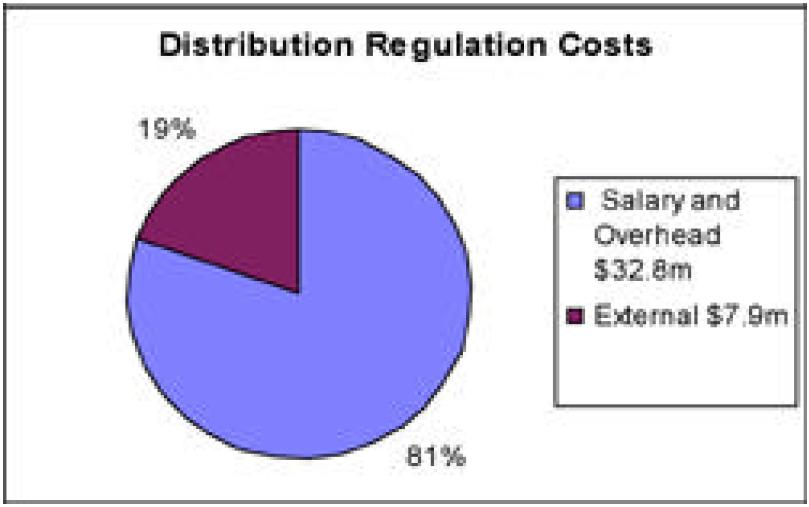
Distribution companies incurred the highest expenditure on regulatory matters, although their spending level is not significantly higher than their share of the industry revenues. Most of the firms are not facing regulatory reviews in the current year and, reflecting this, their external expenditures at only about 20 per cent of total expenditures are relatively low.
COST OF LICENSE vs. THE COST OF MAINTAINING THE LICENSE
Not all the respondents supplied information on their license costs and only tentative conclusions can be drawn in relating these costs to other regulatory spending.
On average, energy companies reporting their licensing costs tend to spend four times as much complying with the regulatory conditions of their licenses than they actually spent obtaining the license. Although a few companies are able to keep the direct costs of meeting the regulatory requirements of the license below the original cost of obtaining it, some companies spend well over ten times the original licensing cost to comply with the regulations surrounding the license.
ENDNOTES
1. The US Office of Management and Budget has not offered recent overall costs of regulatory compliance. A comprehensive GAO report issued in 1998 also did not provide a total cost, (see http://www.gao.gov/archive/1997/gg97002.pdf. In his 1978 article "On Estimating Regulatory Costs," (Regulation, May/June 1978), Murray Weidenbaum estimated that the private sector incurs costs that average twentyfold on-budget regulatory cost. The compliance costs incurred on "social" regulation, like environmental protection, were far greater than those of "economic" regulation of price, market entry etc.
2. See Submission Number 2.
3. If the external employee costs were similar to the costs of actual employees, there would be the equivalent of 472 people involved in the regulatory paperburden. There is however no basis for assuming a similar employee cost of external resources. Even if the costs were similar, the 472 people cannot be compared to the 462 directly employed by the regulators themselves since they too hire external resources.
ATTACHMENT 1
GOVERNMENT REGULATORS
Defining the Resources
There are many different ways of defining regulatory resources. One means, perhaps offering the most accurate information of influence, is by estimating the budgets of the agencies concerned. This would allow for the true resources employed at a time when agencies are increasingly contracting out many of their core functions. Unfortunately, the detail in most government budgets is insufficient to make satisfactory estimates. Hence, the estimates below focus on numbers of regulators.
The core regulatory functions are now normally housed within specialised bodies like the ACCC, NECA, IPART and the ESC. However some clear regulatory functions remain in line departments, like the retail price setting that remains under the purview of the Victorian Department of Natural Resources and Energy.
In addition to these are the "policy" personnel in the mainline departments advising ministers on policy approaches and changes. The regulatory role of this class of industry oversighters is in the main less direct than the overt price and condition setting bodies and many consider that they should not be designated as having a regulatory role. However, setting policy frameworks is the heart of the notion of regulation, and just as the regulatory manager is a part of regulatory resources even though the activity is conducted by more junior personnel.
A third tier of regulators are concerned with sustainable energy. This is a very rapidly growing area of governance and advice. The Sustainable Energy Authority of Victoria (SEAV) now has some 72 staff involved largely in advising, urging and studying matters concerning greenhouse gas emissions. In addition, there are other staff, some 10 within the Victorian Department of Primary Industries, concerned with energy and many more across the bureaucracy covering energy saving policy in areas like building control, transport, and local government.
Other states have comparable agencies. The Commonwealth's Greenhouse Office has a staffing level of 178; SEDA in NSW, which lists not becoming a bureaucracy as one of its goals, declined to provide information on its own size. These environmental agencies are involved either in distorting the energy economy, often by a policy of promoting wind and other unconventional power or, more benignly, offering advice to people on how they might save energy.
A fourth tier of regulation concerns energy safety. The size and responsibilities of these offices varies across the jurisdictions: Victoria is especially well staffed and Queensland less so.
It is the first two tiers of officials that we focus on to offer estimates of regulatory resources. The energy saving/environmental/safety functions are sometimes difficult to disentangle from the "economic regulators", particularly where they are embedded within departments.
Numbers of Government Personnel Involved in Regulation
The numbers below do not include those involved in pure research, like ABARE or, indeed, the Productivity Commission. For the states, only about one third of regulatory resources are in specialised agencies involved in setting prices and conditions. Although more than half of the Commonwealth personnel are housed in such specialised agencies this reflects the essentially federal nature of the NCC, NECA and the NCC.
In all, there are over 450 staff positions (including an allocation for overhead) estimated to be regulating the industry. These numbers may not seem large in the context of an electricity industry of about 30,000 employees and a gas industry totalling more than 2,500. However it must be stressed they are not the sum total of regulatory resources allocated to the industry, only those in mainline economic regulation. It has already been noted that there are very considerable resources allocated to the "social" regulation of energy through safety regulators, greenhouse offices, sustainable energy agencies and through the various parts of environmental agencies that impact upon and in part control the energy industries.
The resources involved within different jurisdictions' government agencies varies. One significant factor might be the degree of public ownership, which could account for the relatively low numbers in the policy agencies in Victoria and South Australia.
| Major Energy Policy Agency | Major Regulatory Agency(s) | Other Policy Agencies | Total | |
| Commonwealth | 38 | 65 | 13 | 116 |
| ACT | 2 | 3 | 5 | |
| NSW | 50 | 30 | 6 | 86 |
| Queensland | 70 | 13 | 6 | 89 |
| S. Australia | 14 | 10 | 6 | 30 |
| Victoria | 21 | 33 | 6 | 60 |
| Western Australia | 35 | 7 | 15 | 57 |
| Tasmania | 5 | 14 | 19 | |
| Total | 235 | 175 | 52 | 462 |
No comments:
Post a Comment