Occasional Paper
ABSTRACT
In his new book Collapse Jared Diamond contends that the Australian environment is generally unproductive and has been irreversibly damaged by European farming, forestry and fisheries practices. Diamond reflects a popular view that is continually reinforced by environmental campaigning in Australia. The reality is more complex. Many Australian farms are amongst the most productive and sustainable in the world and in some situations have successfully broken natural cycles of low fertility. There are many examples where in the past there has been over-exploitation resulting in environmental damage. However government policies now tend to favor conservation over industry. Many once productive forests and fisheries are now closed to harvesting. These areas have become part of Australia's increasing reserve systems. By ignoring the evidence of ecological renewal and suggesting there is everywhere an environmental crisis, Diamond spreads misinformation and makes it difficult to identify the remaining real environmental issues that do need to be addressed.
1. INTRODUCTION
In his new book Collapse (2005), Jared Diamond reviews the state of the Australian environment. In the chapter titled "Mining Australia" (Chapter 13) he states that:
- Australia is the most unproductive continent (380) with low crop yields (381);
- Australia's fisheries, forests and farmlands have been mined and over-exploited (382);
- Land degradation has resulted from clearance of native vegetation, overgrazing, soil erosion, weeds and salinisation (399) and is causing deteriorating water quality with damage to the Great Barrier Reef and Murray-Darling River systems (399, 407);
- Climate change is exacerbating these problems of overexploitation and environmental damage (379).
The chapter contains no data, no tables or figures showing past or current trends with respect to particular indicators, and Diamond makes no reference to particular studies.
Diamond concludes the chapter with comment that the Australian government should voluntarily phase out agriculture: "It would be a first for the modern world if a government voluntarily decided to phase out much of its agricultural enterprise in anticipation of future problems, before being forced in desperation to do so."
In this review I consider Diamond's specific claims against the available evidence.
2. AUSTRALIAN AGRICULTURE
CROP YIELDS
Diamond is unambiguous about one of the major problems with Australian agriculture: "a larger area of land has to be cultivated in Australia than elsewhere to obtain equivalent crop yields" (381). This claim can be relatively easily tested by comparing how many tonnes per hectare of particular commodities are produced in Australia relative to other countries.
More than half of the world's population depends on rice as their main source of calories and protein. Australia has a large rice industry based on irrigation in the Murray-Darling Basin which produces and exports enough rice to feed 40 million people a meal each day every day of the year (FAO 2005). Australian rice growers are amongst the most efficient and productive in the world, producing more than double the world average of 3.77 tonnes per hectare (Table 1) (Duwayri et al. 2000). Furthermore, Australian rice growers have improved their efficiency of water use by 60 per cent over the last 10 years and now use 50 per cent less water for every kilogram of rice produced, compared to the world average (Australian Rice Growers Association, 2005).
Table 1. Rice yield in selected countries
| Average yield (t/ha) | ||
| Country | 1966-68 | 1995-97 |
| China | 3.12 | 6.17 |
| Indonesia | 1.89 | 4.42 |
| Vietnam | 1.81 | 3.73 |
| Egypt | 4.95 | 8.25 |
| USA | 4.96 | 6.74 |
| Australia | 7.33 | 8.23 |
| World Average | 3.77 | |
Source: Duwayri et al. (2000).
Cotton is another significant Australian export, also grown in the Murray-Darling Basin. Again Australia produces more than double the world average on a tones-per-hectare basis (Table 2). Australian cotton producers have not only maintained high yields but by employing genetically modified (GM), insect resistant cotton varieties, they have achieved an average reduction in insecticide use of a phenomenal 88 per cent (Higgins and Constable 2004, Australian Government 2004).
Table 2. Cotton yield in selected countries
| Country Yield | (kg/ha) |
| Australia | 1672 |
| Syria | 1318 |
| Turkey | 1248 |
| China | 1177 |
| Spain | 1159 |
| Brazil | 1151 |
| Ègypt | 937 |
| United States | 745 |
| World Average | 638 |
Source: Cotton Australia (2005).
Over 85 per cent of the sugar produced in Australia is exported. Australian sugar producers are amongst the most efficient in the world on a tonnes per hectare basis (Table 3) (LMC International 2004). However, the protectionist policies and agricultural subsidies of the US, Europe and Japan, which depress the world sugar price by an average 40 per cent (Seales et al. 1999), make it increasingly difficult for Australian producers to stay economically viable.
Table 3. Sugar yield by region
| Region | Sugar per hectare |
| USA (Hawaii) | 12947* |
| Colombia | 11187* |
| India (Tamil Nadu) | 10900 |
| Australia (Herbert/Burdekin) | 10439 |
| South Africa (Nortern Irrigated) | 9860 |
| India (Maharashtra) | 9600 |
| USA (Florida) | 9374 |
| Mexico (Pacific) | 9204 |
| Australia (Southern Queensland) | 8316 |
| China (Guangxi) | 8083 |
| Australia (Northern Queensland) | 7875 |
| Australia (Central Queensland) | 7752 |
| Brazil (C.S.) | 7260 |
| Mexico (Gulf) | 7215 |
| USA (Louisiana-Texas) | 6432 |
| Thailand (North East) | 6363 |
| China (Yunnan) | 5700 |
| Thailand (Central Plains) | 5664 |
| India (Uttar Pradesh) | 5529 |
| Thailand (North) | 5529 |
| South Africa (Kwa-Zulu Natal) | 5311 |
| Phillipines | 4838 |
| Brazil (N.E) | 4753 |
| Indonesia | 4554 |
| Pakistan | 3956 |
| Cuba | 2156 |
*This figure may have not been adjusted for the 2-year crop cycle in Hawaii and Colombia.
Diamond does not specify which crops yield so poorly in Australia, but he does make specific mention of oranges. Diamond claims that, "it is cheaper to grow oranges in Brazil and ship the resulting orange juice concentrate 8,000 miles to Australia than to buy orange juice produced from Australian citrus trees." Australia currently exports almost three times the quantity of citrus it imports (ABARE 2004). During the 2003/04 financial year Australian producers exported navel and valencia oranges worth AUD $107 million (ibid).
Indeed, Australia exports most of the food it produces with crop exports valued at AUD $13,269 million in 2003/04 (ibid). Wheat was the highest earner worth AUD $3.475 billion in the 2003/2004 financial year.
Wheat is one of the few Australian crops with a yield that is well below the world average (Table 4). The very low yield per hectare for Australian wheat reflects the economics of wheat-growing in Australia, since superior agricultural land is used to grow crops that have a relatively higher value. Australian wheat is generally not irrigated and growing regions are amongst the driest in the world (Donath and McGarrity 1976). Nevertheless Australia produces and exports relatively large volumes of wheat and other cereals because land is not scarce relative to other OECD countries. Tremendous economies of scale can be achieved, and the industry is highly mechanised (Southgate, forthcoming).
Table 4. Wheat yields by region
| Country/Region | Yield (100 kg/ha) |
| Australia | 20.1 |
| World average | 26.8 |
| Europe | 44.4 |
| North America and Canada | 27.7 |
| South America | 25.5 |
| Asia | 27.9 |
| Russian Federation | 15.8 |
| Africa | 22.3 |
| Oceania | 20.3 |
Source: Makarov (2005), International Grains Council (2005).
The evidence contradicts Diamond's claims about Australian agriculture: it is highly productive with some commodities achieving double the world average on a tonnes per hectare basis.
MINING THE SOIL
Diamond suggests Australian farmers have irresponsibly mined the country's soil resource with "soil nutrient exhaustion" identified as a type of land degradation (398). Diamond states that Australian soils are naturally unproductive because they are "so old" that they have become leached of nutrients (380) and are thus are more susceptible to mining.
This argument is flawed. Any agricultural system that does not apply fertiliser or manure at cultivation would be "mining the soil resource". The more nutrient rich the soil is, the more potential there is for mining to occur.
Since the time of European settlement, fertilisers have been applied to Australian soils to raise the base level of plant nutrients in the soils, and also to replace nutrients removed by the previous harvest. Contrary to Diamond's assertion that Australia's soils are poorer now than they were at the time of European settlement, in his book Natural Gain in the Grazing Lands of Southern Australia, agronomist David Smith documents how European settlers broke what was previously a cycle of low fertility by adding plant nutrients (e.g. super phosphate) and new plant species (e.g. subterranean clover) -- with the result that large amounts of atmospheric nitrogen and solar energy could be (and were) captured by the developing grazing and broad acre cropping industries. Smith describes this process as one of "natural gain" (2000).
In the past two decades there has been a second revolution in Australian farming, through the adoption of minimum tillage cultivation systems. For example, adoption of green cane harvesting and trash blanketing (GCTB) in the sugar industry has greatly reduced the potential for soil erosion and greatly increased the potential for improvements in soil structure by facilitating the return of organic matter.
The speed of adoption of GCTB in the sugar industry greatly exceeded the expectations of the Australian Conservation Foundation, which had predicted less than 50 per cent of sugarcane farmers in the Mackay region would adopt the minimum tillage systems by 2000 -- yet over 85 per cent of Mackay cane growers used the GCTB system by 2000 (Geno, 1996). Under a GCTB system, soil loss is equivalent to levels in a natural rainforest situation (Johnston et al. 1997).
KILLING THE GREAT BARRIER REEF
The move to more environmentally friendly farming practices, the phasing out of many insecticides and the adoption and promotion of a voluntary code of practice among farmers, did not stop the World Wide Fund for Nature (WWF) from launching an attack on the sugar industry in June 2001 (Wood, 2002). Diamond repeats propaganda from this campaign, which claims that reef waters have become more turbid and are now killing the Great Barrier Reef (400).
Despite an absence of supporting data, the WWF campaign resulted in calls to "reduce the impacts on the Great Barrier Reef of land based sources of nutrients, sediment and pollution" and finally in the legislating of impractical water quality targets with statutory effect.
A case study by Wood (2002) reviews the research papers provided by the scientists and activists as the "best evidence" for an agriculture impact on the Great Barrier Reef. This information indicates that mangrove dieback has occurred at least once in one region, seagrass beds have expanded in at least one region, and the ability of some reef communities to grow coral has changed. Two papers provide evidence for traces of human-made chemicals in marine sediments, but there is no evidence to suggest that these very low, but detectable levels, currently have any impact on the Reef (ibid, Marohasy, 2003a).
The health of corals can be reliably measured through coral cores, which measure and compare calcification rates dating back to the 1400s. These studies have demonstrated that during the 20th century, calcification rates (i.e. coral growth rates) increased by an average of 4% across the reef system including corals of the inner shelf (Lough and Barnes, 2000).
There is no evidence of deteriorating reef water quality (Furnas et al. 1995). The inner reef (within 15km of land) is naturally nutrient rich and very muddy (Larcombe and Woolfe, 1999; Larcombe, 2001). Contrary to popular perceptions, inner shelf corals and many inshore underwater communities thrive under conditions of relatively high turbidity. Furthermore, published studies indicate that sediment input from land-based sources, even under flood conditions, is far less than that held in suspension by natural swell waves on more than 200 days per year in the naturally muddy inner shelf of the central Great Barrier Reef. While the inner reef is naturally muddy because of sediment deposition that has occurred over many thousands of years, the middle and outer reef are sediment- and nutrient-starved, and the extraordinary event that results in some land-based nutrient and sediment getting beyond the inner reef may be beneficial to these systems.
In summary, contrary to what Diamond ascertains, the available evidence indicates the Great Barrier Reef is healthy.
IRRIGATED AGRICULTURE
Diamond states that 80% of Australia's agricultural profits are derived from less than 0.8% of its agricultural land (413). It is unclear how Diamond derived this statistic and how he calculated profit. Irrigated agriculture occupies less than 0.5% of the agricultural land in Australia and in an average year contributes approximately half of total agricultural profits (Hajkowicz and Young 2002) and 26% of total gross value of production (Commonwealth of Australia 2001). Perhaps Diamond was extrapolating from this data.
Diamond goes on to suggest that because most profit is derived from a relatively small land area, most of the land mass of Australia supports unproductive and unprofitable agricultural systems (413). This argument is flawed. It does not follow that because, for example irrigated agriculture is profitable, the rest of Australian agriculture is unprofitable, though it is apparently less profitable. Australian agriculture would be much more profitable if the US, Europe and Japan did not subsidise their agricultural industries.
Much is made of Australia as the driest inhabited continent on earth; calculated on the basis of available water on a per hectare of land mass basis. Because Australia is very large, and because Australia has some large desert, this approach hides the reality of Australia's tremendous water resources. Indeed according to the World Resource Institute, Australia has 51,000 litres of available water per capita per day. This is one of the highest levels in the world after Russia and Iceland and well ahead of countries such as Indonesia (33,540), the United States (24,000), China (6,000) and the United Kingdom (3,000 litres per capita per day) (Lomborg, 2001).
Less than 5% of the water that falls on Australia is diverted for use by agriculture, industry and cities. Most rain falls across northern Australia. There are large tracts of extremely fertile land in the north that are undeveloped. Environmental activists demand that these areas remain untouched. Where there is an established water infrastructure supporting irrigated agriculture, for example in the Murray Darling Basin, agriculture has been subject to relentless campaigning to return water to river systems as environmental flow.
SALINISATION
Diamond suggests that salinisation has rendered much of the most highly productive farmland in Australia "less productive or useless" (402). The Australian Bureau of Statistics Land Management Survey 2002 indicates that two million hectares of agricultural land shows signs of salinity with 70% of the area affected being in Western Australia. This represents 0.2% of all farmland.
Much has been made of the potential for salinity to worsen in Australia but no data exists to suggest the areas at risk (drylands or irrigated land) have actually increased over the last decade. There are examples where the area at risk of salinity has contracted significantly. For example, in the mid 1980s, modeling indicated that 127,000 hectares of irrigated land in New South Wales had water tables within 2 metres of the surface and was at high risk from irrigation salinity. Furthermore, this area was thought likely to increase to 331,000 hectares within the next 50 years (Figure 1). Remedial action was taken, and the area at risk of salinity is now less than 14,000 hectares -- this represents a reduction of approximately 90% (Wood, 2003).
Figure 1. Area Considered at Risk of Salinity & Area actually affected by shallow water tables compared to area expected to be affected in the Murray Irrigation Area.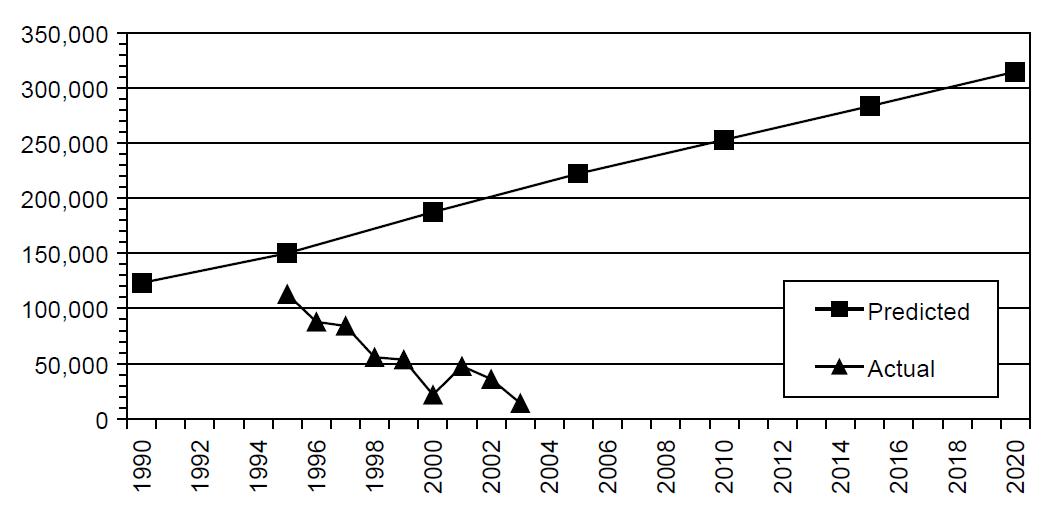 Source: Wood, 2003
Diamond also claims that rising salt levels will render Adelaide's drinking water too salty for human consumption in an unspecified and contingent future (pg. 402). There were problems with rising salt levels in the Murray River in the 1970s, but through the construction of salt interception schemes and improvements in on-farm drainage, the problem has been fixed. Salt levels at the key site of Morgan (just upstream from the off-shoots for Adelaide's drinking supply) have in fact halved over the last 20 years (Figure 2).
Figure 2. Salinity at Morgan Yearly averages for salinity (EC micro Siemens per cm) at Morgan Source: Data provided by the Murray Darling Basin Commission on 21st September 2004
GENERAL TRENDS IN FARMING
While the percentage of Australia's land mass cultivated for crops or as sown pasture has remained steady at 6% since the early 1980s (Australian Bureau of Statistics, 2003), there has been a 25% increase in the area under irrigation and a reduction of 19% in the total number of farms (Wolcott et al. 2004). There has been a general shift from livestock production into cropping because cropping has generally become more profitable (O'Donnell, 2005).
The total value of Australia's agricultural exports is forecast to be $28.2 billion in 2005-06. This is an increase of $237 million on 2004-05 (ibid). There is no evidence for general yield decline in Australian agriculture as claimed by Diamond, rather through technological innovation there has been continuous improvement (Heggeler 2004). Australia is not unique in this regard with the world's farmers managing over the last 40 years, with the help of technology (including fertilisers, pesticides, irrigation and new varieties), to now produce approximately twice the amount of grain and oil seed from essentially the same area of land (Chrispeels and Sadova, 2003).
At the same time, Australian agriculture has generally become more environmentally friendly through methods such as improved water use efficiency, minimum tillage cultivation systems and GM crop varieties that require fewer pesticides.
3. AUSTRALIAN FISHERIES
In volume terms Australia is a small seafood producer ranked 53rd in the world (Hanna et al. 2005). But by value Australia is more significant ranked 21st. Australia imports relatively large volumes of low value fish and crustaceans, and exports relatively small volumes of high value fisheries products (ibid). Australia produced $2.2 billion worth of fisheries products in 2003-04. Aquaculture production has increased by 80% over the last decade and now accounts for 16% of total production by volume (ibid). By comparison the wild catch has increased by only 7%.
Yet Diamond claims that Australia's freshwater and marine fisheries have been "mined", with one fishery after another depleted to uneconomically low levels (406). Diamond lists several marine species as examples, but provides no information or data to support his thesis. His single freshwater example is the Murray cod fishery which Diamond claims has been "closed because of the decline and collapse of the catch."
In this section I summarise the available information for all the species which Diamond claims as at risk of overfishing. Official fishery status reports are available for school sharks and for many of the trawl species including tiger flathead, orange roughy, eastern gemfish and southern bluefin tuna (AFFA 2004). Information on Exmouth gulf tiger prawns was sourced from the Department of Environment and Heritage. Both coral trout and Murray cod are caught by line fishing and there have been no recent status reports on these species. Both species have been the subject of sustained environmental campaigning and the available evidence on species abundance is not easily reconciled with popular perceptions.
EXMOUTH GULF TIGER PRAWNS
The prawn referred to by Diamond as the Exmouth gulf tiger prawn is more normally referred to as the common brown tiger prawn (Penaeus esculentus). This species, endemic to Australia, has an established wild fishery from Moreton Bay in south eastern Queensland to Exmouth Gulf in northern Western Australia. This extensive wild prawn fishery is supplemented by a prawn aquaculture industry worth more than $64 million in 2004, and growing (AFFA 2004). The prawn fishery specific to the Exmouth Gulf includes a total of four prawn species and has a total value of about $13 million. The fishery is heavily regulated with management controls on vessel number, size and power. Since 1999 there have been extended closures of this fishery aimed at increasing its overall economic efficiency and sustainability. Two commercial boats are used to collect fishery-independent data to understand the level of tiger prawn recruitment and spawning each year. Based on this information the fishery is currently considered sustainable by the Australian Government's Department of Environment and Heritage (Department of the Environment and Heritage 2002).
TIGER FLATHEAD
The tiger flathead trawl fishery (Neoplatycephalus and Platycephalus spp.) is part of what is known as the South East Fishery and managed by the Australian Fisheries Management Authority (AFMA). Current catch-levels appear sustainable. The annual catch from trawl and non-trawl sources has slightly exceed the agreed total allowable catch (TAC) (Figure 3).
Figure 3. Tiger Flathead: Total Catch 1992-2002 TAC is the Total Allowable Catch Source: Fisheries Status Reports, Department of Agriculture, Fisheries and Forests (2005)
EASTERN GEMFISH
The Eastern Gemfish (Rexea solandri) is also part of the South East Fishery and currently classified as overfished (Figure 4). According to AFFA more stringent management measures are needed to protect spawning aggregations and juvenile fish including by reducing losses through trawl bycatch. There are currently no formally agreed recovery plans for rebuilding this fishery.
Figure 4. Eastern Gemfish: Total Catch 1992-2002 TAC is the Total Allowable Catch Source: Fisheries Status Reports, Department of Agriculture, Fisheries and Forests (2005)
ORANGE ROUGHY
Orange roughy (Hoplostethus atlanticus) was only discovered in commercial quantities in Australian waters in 1981. Rapid exploitation of this fishery followed and by 1990 there was evidence of overfishing. Since 1990 management zones have been created with the aim of protecting and rebuilding the fishery. The actual total allowable catch (ATC) closely correlates with the agreed total allowable catch, however, according to a 2001-2002 AFFA assessment, the AFMA should close this fishery.
SOUTHERN SHARK FISHERY
Catches of school shark (Galeorhinus galeus) declined sharply in the early 1970s, when concerns over mercury content led to a legal maximum size for sale (Figure 5). The recent decline in catch is due in large part to quota restrictions. The total allowable catch (TAC) for 2002 was set at 327 tonnes, in line with the agreed harvest strategy. A catch of 197 tonnes was reported. The quotas are intended to enable the mature biomass to rebuild by 2011 to above the 1996 level with an 80% probability.
Figure 5. Gummy and School Shark: Total Catch and Effort 1970 to 2002 Source: Fisheries Status Reports, Department of Agriculture, Fisheries and Forests (2005)
SOUTHERN BLUEFIN TUNA
Southern bluefin tuna (Thunnus maccoyii) is currently classified as overfished (AFFA, no date). The fishery is shared with Japan, Indonesia, Taiwan, Korea and New Zealand. The total global catch peaked in 1961 at 81,605 tonnes and was then in general decline for three decades, Figure 6. Since 1990 the total catch has ranged from between 13,231 tonnes (1994) to 19,588 tonnes (1999). Stock assessments suggest that the parental biomass is low but stable and unlikely to recover to target levels unless all countries agree to abide by national allocations as determined by the Commission for the Conservation of Southern Bluefin Tuna. Australia operates within its allocation, Japan has not agreed to operate within its allocation, and Indonesia does not recognise the Commission.
Figure 6. Southern Bluefin Tuna: Total Catch 1950-2001 Source: Fisheries Status Reports, Department of Agriculture, Fisheries and Forests (2005)
CORAL TROUT AND THE GREAT BARRIER REEF FISHERY
Coral trout (Plectropomus leopardus) has a distribution from the Red Sea to the West Pacific. Coral trout are the most heavily line fished species on Australia's Great Barrier Reef. The fishery is monitored by the Great Barrier Reef Marine Park Authority (GBRMPA) but there have been no published assessment reports that provide quantitative long term trend data on species abundance.
The Queensland Department of Primary Industries has data on catch per unit effort for the aggregate Great Barrier Reef commercial line fishery. This information indicates the fishery is sustainable as there has been no decline in the harvest rate (Ayling and Ayling 1983a, 1983b, 1984a, 1984b, 1985, 1986). The annual yield for the entire Great Barrier Reef has been calculated at 17 kg/km2. This is very low relative to other Pacific Reefs which average 7,700 kg/km2 with a sustainable yield calculated at 10,000 kg/km2, Figure 7 (Adams et al. 1996, Ayling and Ayling 1983b).
Figure 7. Annual Yield of Pacific Fisheries Source: Based on Adams et al. (1996). Drawn by Walter Stark.
Diamond suggests that the "low productivity" of Australia's fisheries (406) is a consequence of overfishing, but in the case of the Great Barrier Reef, the low productivity is a direct consequence of ever greater limits placed on the commercial and recreational catch. These restrictions have been driven by environmental campaigning that has created the perception that there is overfishing including of coral trout. The most recent restrictions resulted in many popular fishing areas declared "Green Zones" with all fishing banned from these areas.
The GBRMPA has commissioned many surveys of coral trout beginning in the early 1980s and this body of information now totals hundreds of surveys across the entire reef system. According to the recreational fishing lobby, these studies make up the most extensive and long term body of population information available for any reef fish anywhere in the world, but remain unpublished and difficult to access. The information indicates coral trout numbers are not in decline but rather increased during the 1980s and 1990s (Stark 2003).
Survey results based on counts of live fish indicate that:
- Average density of coral trout at three regularly fished reefs off Townsville was 34/ha in 1983, 34.3/ha in 1989 and 66/ha in 1994.
- Average density of coral trout off Cairns was 22.5 fish/ha in 1983 and 31.7/ha in 1991.
- Off the Whitsunday Islands, counts on three reefs found 57/ha in 1984, 84/ha in 1988 and 124/ha in 1994.
MURRAY COD: A FRESHWATER FISHERY
Murray cod (Maccullochella macquariensis) is native to the river systems of the Murray-Darling Basin and also some coastal rivers in south east Queensland and northern New South Wales.
In July 2003, the species was added to Australia's list of threatened species. The listing was based on a 30% decline in Murray cod numbers during the previous 50 years as measured by the commercial catch. This information, as provided in a media release by the Federal Environment Minister, Dr David Kemp, was misleading and factually incorrect (Kemp 2003). The fishery had been closed in 2001 (two years before the species was added to the list of threatened species) and there had not been a 30% decline over 50 years. Rather, there had been a crash in total catch in the late 1950s, with the total catch since this time low but stable (Figure 8).
Figure 8. Total Catch of Murray Cod, 1947-1996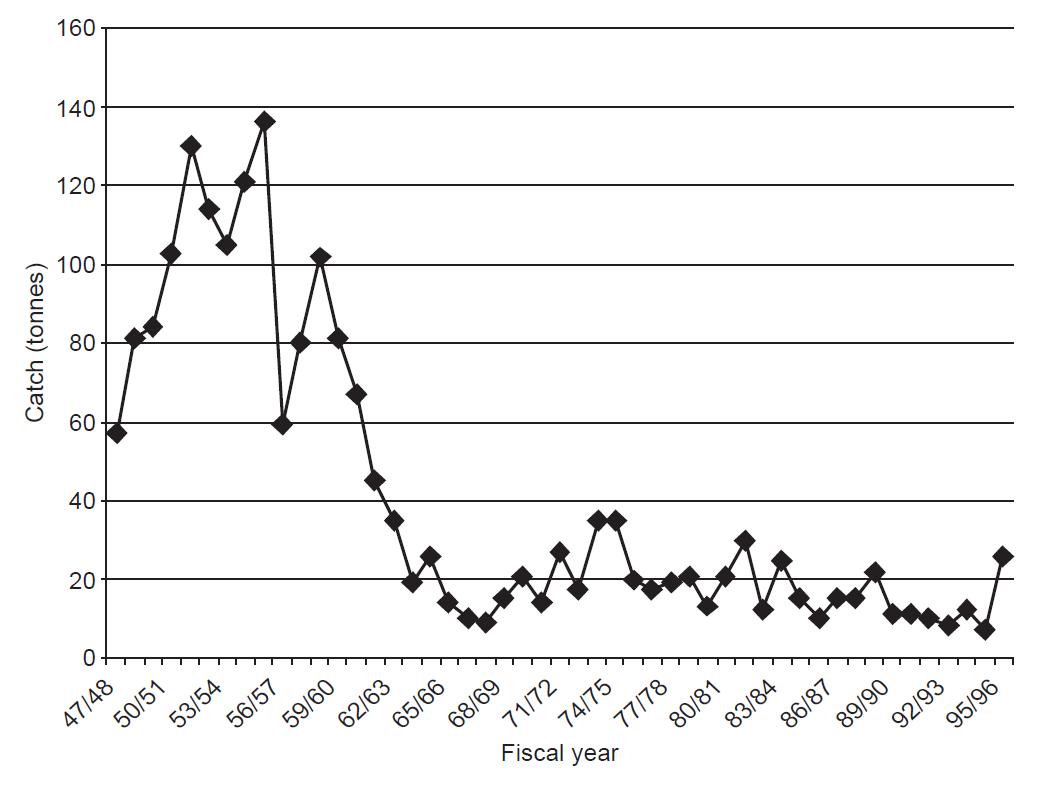 Source: NSW Inland Commercial Fishery Data Analysis,
Fish Research and Development Corporation, 1997
Furthermore, numbers of commercial fishers in the Murray region has varied with a peak of 280 licences operating in 1971, dropping to 40 licences in 1996-97, before all licences were revoked in 2001. The fishery closure was not a result of a recent of "decline and collapse" as stated by Diamond, but rather the result of environmental campaigning. Catch per unit effort for the Murray River fishery was actually increasing at the time the fishery was closed (Figure 9).
Figure 9. Commercial Catch per Unit Effort, 1984-85 to 1995-96 Source: NSW Inland Commercial Fishery Data Analysis,
Fish Research and Development Corporation, 1997
If the apparent collapse in the fishery in the late 1950s was real, and due to overfishing, then numbers of Murray cod should now be on the increase, particularly given the commercial fishery has been closed and given the substantial restocking effort. Over 3.5 million Murray cod were released into the river system during the 1990s. Incredibly, it is unclear how populations of Murray cod are faring, as there is no monitoring program in place for this iconic fish species, and because the commercial fishery has been closed there is no commercial catch data.
4. AUSTRALIAN FORESTS
The prognosis according to Diamond is that Australians are cutting down too many trees and as a consequence Australia's forests will disappear long before its coal and iron reserves. Diamond states that of the trees standing at the time of European settlement in 1788, 40% have already been cleared, 35% have been partly logged and only 25% remain intact (404). Diamond does not indicate when most of the trees were cut down, or how many trees might have re-grown since 1788, nor does he cite any specific reports or research papers to support his claims.
Since the 1930s, all Australian State governments have created forest services to manage the public forest estate. There has not been a decline in the area of publicly managed native forest since this time (Department of Agriculture, Forestry and Fisheries 2005).
VICTORIAN RED GUMS
Diamond makes reference to "now-felled Victorian Blue Gums" as once possibly the world's tallest trees (404). Forests in southern Australia were extensively logged during the 1800s with large quantities of timber cut for building and operating riverboats, gold mining and as sleepers for local and overseas railways. A Victorian Conservator of Forests was appointed in 1888 at a time when there was community concern the forests would be completely destroyed. At the same time a duty was imposed on timber exports.
The forests re-grew.
Surveys during the 1900s showed that while significant quantities of timber continued to be harvested from these forests, growing stock and saw log volumes increased (Department of Sustainability and Environment 2002). These forests were mostly managed for "multiple use" including as a source of clean water, for wildlife, recreation and also for timber production.
Diamond suggests that Australia imports nearly three times more forest products than it exports because it has "mined its forests" and there are now none left. In fact the deficit can be attributed to active environmental campaigning against the timber industry beginning in the early 1980s (Watson 1991). As a consequence, the larger and once highly productive native forests on mainland Australia are now mostly part of the national reserve system and logging has been banned. For example the Barmah Forest in north-western Victoria with the largest stands of river red gums in Australia, became a listed site under the Ramsar treaty in 1982, which made it a "Wetland of International Importance". This forest, once managed for multiple-use, is now managed only for nature.
Since 1992 the National Forest Policy Statement has established Australia's forest agenda. In 1996 a Regional Forest Agreement (RFA) commenced with the aim of setting aside additional reserve areas, and establishing nationally agreed methodologies and criteria for sustainable forest management outside of the reserve areas.
In regions which still support forestry, industry protection of old-growth forest was identified as a priority. As a consequence, the area of old-growth forest in reserves has increased by 1.2 million hectares and is now 3.7 million hectares (Table 5). This constitutes 71% of the total 5.2 million hectares of old-growth forest covered by Regional Forest Agreements (Bureau of Rural Sciences 2004).
Table 5. Area of old growth forest protected ('000 hectares)
| State | Total forest | Total old growth | Old growth in reserves |
| New South Wales | 8,992 | 2,536 | 1,742 |
| Queensland | 3,230 | 270 | 166 |
| Tasmania | 3,169 | 1,239 | 851 |
| Victoria | 5,744 | 841 | 455 |
| Western Australia 1 | 2,121 | 347 | 233 |
| South Australia 2 | |||
| Australia Native Forest Total | 23,256 | 5,233 | 3,447 |
1 All old growth forest in WA is protected by Government policy.
2 South Australia was not subject to the RFA process.
Source: Department of Agriculture, Forestry and Fisheries (2003).
TASMANIAN FORESTS
Diamond comments that, "Most of the logging and the fiercest debate are going on in the State of Tasmania, where (old growth) Tasmania Blue Gums … are now being logged faster than ever". Diamond, however, is confusing Eucalyptus species. Blue gums are Eucalyptus globulus. The logging debate in Tasmania is mostly about the Eucalyptus species regnans, delegatensis and obliqua. It is these species which are often described as the tallest trees outside of California. Furthermore, contrary to popular perceptions, these tall trees are well reserved as the Tasmanian government policy is to protect tall trees of greater than 85 m (280 feet) (Forestry Tasmania, 2002).
Tasmania has 40% of its total land area and its forests protected in reserves (Resource Planning Development Commission, 2002a) and 95% of its high quality wilderness areas are fully protected (Resource Planning Development Commission, 2002b). In 2001, 69% of the 1.24 million hectares of old growth forest in Tasmania were protected in reserves (ibid) and this area will increase following recent intense campaigning by environmentalists.
Old-growth forests generally contain higher timber volumes than younger growth stages, and are often intimately mixed with regrowth forests, so access to regrowth areas depends on harvesting associated old growth forest. Environmental interest groups in Australia want a total ban on the harvesting of these forest types. Between 1 July 2001 and 30 June 2003, 2,680 ha of old growth was clear felled in Tasmania (Forestry Tasmania, 2003); this represents 0.1% per annum of the current old growth in that State.
LAND-CLEARING IN NORTHERN AUSTRALIA
Over the last decade the highest rates of land clearing occurred in northern Australia's rangelands in association with cattle grazing (Burrows, 2002). For example, according to the Australian Bureau of Statistics, 470,000 hectares of land were cleared in 1999 alone, with 90% of this clearing occurring in Queensland (Australian Bureau of Statistics, 2002b). At the time of European settlement many of these rangeland areas were open grasslands and were formerly maintained as grassland by aboriginal burning (Burrows, 1991). In the absence of fire, and with grazing pressure, there has been a general and rapid vegetation thickening, resulting in more trees per hectare now than there was at the time of European settlement (Neldner et al. 1997; Burrows, 1999; Fensham and Skull, 1999; Fensham, 1998a; Fensham, 1998b). Even during the peak of land clearing which occurred during the 1990s, satellite data showed there was a net increase in forest cover of 5 million hectares (Department of Natural Resources, 2003). This same data showed, for example, that 26% of all clearing in 2000-2001 was of land that had no trees in 1991. In short, many cattlemen clear trees in an attempt to maintain once open grassland areas, against a general trend of woodland thickening and forest encroachment.
But Diamond takes the same approach to tree cover as the environmental campaigners. He does not consider the net change in forest cover, but rather focuses only on how many trees have been cleared. In short, Diamond assumes that trees do not re-grow! As a consequence of environmental campaigning that has created a perception in metropolitan Australia that there are ever fewer trees in the remote rangeland areas, legislation was enacted in 2004 that will ban most tree-clearing in Queensland from 2006.
5. AUSTRALIA AND CLIMATE CHANGE
In Diamond's view climate change is exacerbating the environmental damage caused by Australia's primary industries (379). Citing a decline in winter rainfall in Western Australia's wheat belt as the only example, Diamond suggests that Australia will be a big loser from climate change (385). This is also the official assessment in Australia. Reports based on scenario modelling, founded on the work of the Intergovernmental Panel on Climate Change (IPCC), have concluded that it will mostly get drier as it gets hotter (Hennessy et al. 2004; Department of Sustainability and Environment, 2004). The IPCC, however, has emphasised that "In climate research and modelling we should recognise that we are dealing with a coupled non-linear chaotic system and therefore that long-term predictions of future climate states is not possible." Despite this clear note of caution, the output from these models has been reported in the Australian press as a realistic forecast.
Australia's climate has always changed. Evidence from natural history indicates that rising sea levels drowned large areas of Australia's coastline beginning about 15,000 years ago, which was the end of the last Ice Age. Notably, while it is thought to have been generally drier in terms of precipitation (rainfall) during the last Ice Age, parts of inland Australia which are now desert were inland lakes during that period, fed by glacial runoff from the Snowy Mountains.
The Australian Bureau of Meteorology possesses temperature and climate records for the last 100 years. While the popular perception is that climate has generally gotten drier over this period, their statistics show that much of Australia, including the relatively heavily populated east coast, has actually become wetter over the last 100 years (Australian Bureau of Meterology). Southwestern Australia and Western Queensland are exceptions; these areas have become drier.
According to Diamond, Australian agriculture is contributing to global warming through land clearance. Through the banning of the land clearance the Australian Government estimates that it will reduce carbon-dioxide emissions by 24.4 million tonnes. The woodland thickening and forest encroachment that is occurring across Australia's northern rangelands is not counted in the nation's greenhouse budget. If it were included, it has been calculated that Australia's total net greenhouse gas emission would be reduced by 25% (Burrows et al. 2002).
6. CONCLUSION
In a world full of information, but much of it spin, it can be very difficult to distinguish propaganda from fact. Anyone who wants to understand the world as it really is will need to apply a good deal of self-discipline and focus on the evidence.
The central theme of Diamond's book is fascinating -- why some societies collapse and others thrive. Australia would have made a good case study, as the histories of Australia's primary industries include examples of near collapse and also examples of spectacular renewal. The importance of secure property rights, environmental activism and utilisation of modern technology are a part of this story. Diamond, however, ignores these factors and influences while he uncritically accepts propaganda from environmental interest groups.
Diamond set out to write a story about environmental damage and he has not let the facts get in the way of this predetermined agenda. By relying almost exclusively on secondhand reports from environmental activists, Diamond incorrectly concludes that the Australian environment is on the brink of collapse. There is no new message in Diamond's trite and inaccurate assessment of the situation. He simply restates popular perceptions, and then concludes that environmental problems are accelerating exponentially out of control (416).
By evaluating Diamond's specific claims of environmental collapse against the received evidence, it can be concluded:
- Perceptions are not reality. The Australian environment is not "accelerating exponentially out of control."
- Australian agriculture is generally profitable and high yielding, though profitability is not necessarily linked to productivity.
- Farmers have overcome the low fertility of many Australian soils through the use of fertilisers, manures and nitrogen fixing pastures species.
- Many farmers have reduced the potential for soil loss and erosion through the adoption of minimum tillage techniques.
- The Great Barrier Reef is healthy and not affected by agriculture.
- Australia has significant water resources which continue to be well-managed. Water efficiency in agriculture is comparatively high on a global scale, and improving.
- Issues of salinisation including rising salt levels in the Murray River have been addressed. Salt levels in the Murray are now half of what they were when they peaked in the early 1980s, and dryland salinity is not spreading.
- Australia's farmers, foresters and fishers are under intense pressure from environmental activists.
- High profile environmental campaigning, and the success of the same campaigns, does not correlate with environmental need. For example there has been a successful campaign to close coral trout fisheries where the yield is arguably well below sustainable levels. At the same time no action appears to have been taken to effectively address all issues of over-fishing in the South East Fishery.
- Several marine fisheries appear to be over-fished, yet there is no formally agreed recovery plan for the same species, including the southern bluefin tuna fishery.
- Australian forests are generally well-managed.
- Changing community values, driven by environmental campaigning, has resulted in large areas of forest that were once managed for multiple-use becoming part of the national reserve system, with logging now banned.
- There has been a general increase in forest cover, particularly in northern Australia.
- Australia's climate has always changed. Contrary to popular perceptions much of Australia has gotten wetter, not drier, over the last 100 years.
Diamond is a professor of science and his book Collapse has been promoted as a work of non-fiction. Sadly, the chapter concerning Australia is full of factually incorrect information. His general philosophical approach and disregard for the evidence is an affront to his profession and to science. The book is also an affront to the many farmers, fishers and foresters in Australia who have worked hard to address issues of environmental degradation and strive for best practice and ecological renewal. Furthermore, by ignoring the evidence and denying the good news stories, Diamond prevents an understanding of how and why societies can overcome issue of scarcity and build sustainable primary industries without "collapsing". By suggesting that there is an environmental crisis everywhere, Diamond makes it difficult to prioritise issues and difficult to discern real environmental need.
ACKNOWLEDGEMENTS
I would like to thank Walter Stark, Alan Ashbarry and Bernard Milford for help with not-so-easy-to-find information on fishing, forestry and sugarcane farming respectively.
REFERENCES
ABARE (2004). Australian Commodity Statistics, Canberra.
Adams, T., Dalzell, P. and Farman, R. Status of Pacific Island Coral Reef Fisheries. (1996). 8th International Coral Reef Symposium, Panama. pp.1-7.
AFFA (2004). Aquaculture Australia Industry Report, Canberra.
Australian Bureau of Meteorology. (no date).
Australian Bureau of Statistics (2003). Year Book Australia 2003, Canberra.
Australian Bureau of Statistics (2002a). Land Management Survey, Canberra.
Australian Bureau of Statistics (2002b). Measuring Australia's Progress, Canberra.
Australian Rice Growers Association. (viewed 14th March 2005).
Australian Government. (2004). Annual Report 2003-2004, Cotton Research and Development Corporation, Canberra.
Ayling, A.M., & Ayling, A.L. (1983). "Distribution and abundance of coral trout species (Plectropomus spp.) in the Cairns section of the Great Barrier Reef Marine Park." Unpublished report to Great Barrier Reef Marine Park Authority.
Ayling, A.M., & Ayling, A. (1983). "Distribution and abundance of coral trout species (Plectropomus spp.) in the Townsville and Whitsunday area of the Great Barrier Reef Marine Park." Unpublished report to GBRMPA.
Ayling, A.M., & Ayling, A. (1984a). "Distribution and abundance of coral trout species (Plectropomus spp.) in the Swain group of reefs." Unpublished report to GBRMPA.
Ayling, A.M., & Ayling, A. (1984b). "A biological survey of selected reefs in the far north section of the Great Barrier Reef Marine Park." Unpublished report to GBRMPA.
Ayling, A.M., & Ayling, A. (1985). "A biological survey of selected reefs in the Central Section of the Great Barrier Reef Marine Park." Unpublished report to GBRMPA.
Ayling, A.M., & Ayling, A. (1986). "A biological survey of selected reefs in the Capricorn and Capricornia Sections of the Great Barrier Reef Marine Park." Unpublished report to GBRMPA.
Ayling, A.M., & Ayling, A. (1992a). "Coral trout survey data: raw data sheets and abundance summaries from all surveys of coral trout species (Plectropomus spp.)" carried out by Sea Research for the GBRMPA between Feb. 1983 and July 1986. Unpublished report to GBRMPA. 1986.
Ayling, A.M., & Ayling, A. (1992b). "Visual surveys on Cairns Section closed reefs that will be opened under the new Zoning Plan." Unpublished report to the GBRMPA.
Bureau of Rural Sciences (2004). Science for Decision makers -- Old Growth Forests in Australia, Canberra.
Burrows, B. (1999). "Tree clearing -- rehabilitation or development on grazing land?" IV International Rangelands Conference, Townsville, Australia.
Burrows, W.H. (2002). "Seeing the wood (land) for the trees -- An individual perspective of Queensland woodland studies (1965-2005)", Tropical Grasslands 36: 202-217.
Burrows, W.H. (1991). Sustaining productive pastures in the tropics 11. An ecological perspective. Tropical Grasslands 25: 153-158.
Chrispeels, M.J. and Sadova, D.E. (2003). Plants, Genes and Crop Biotechnology, 2nd edn, American Society of Plant Biologists, Los Angeles.
Commonwealth of Australia. (2001). "Australian Natural Resource Atlas: Agriculture". National Land Water Audit. (Viewed on 16th March 2005).
Cotton Australia (2005). (Viewed 15 March 2005).
Department of Agriculture, Forestry and Fisheries (2003). National Forest Inventory.
Department of Agriculture, Forestry and Fisheries (2005), Changes in Forest Cover, 1788-1980. (Viewed 8 March 2005).
Department of Agriculture, Forestry and Fisheries (no date), Fishery Status Reports. (Viewed 8 March 2005).
Department of the Environment and Heritage, Assessment Report of the Exmouth Gulf Prawn Fishery, Canberra 2002.
Department of Natural Resources. (2003). Land Cover Change in Queensland 1999-2001. Queensland Government, January 2003.
Department of Sustainability and Environment (2002). Forest Management Plan for the Mid-Murray Forest Management Area, Melbourne.
Department of Sustainability and Environment (2004). Securing our Water Future Together, Victorian Government White Paper, Melbourne, June.
Diamond, J. (2005). Collapse: How societies choose to fail or succeed. London: Vintage.
Donath, E.J., McGarrity, J. (1976). Wheat in Australia, Oxford University Press.
Duwayri, M., Tran, D.V., Nguyen, V.N. (2000). "Reflections on Yield Gaps in Rice Production: How to Narrow the Gaps", in: Papademetriou, M.K., Dent, F.J., Herath, E.M. eds., Bridging the Rice Yield Gap in the Asia-Pacific Region, FAO, RAP Publication: 2000/16.
Fensham, R.J. (1998). "The influence of cattle grazing on tree mortality after drought in savanna woodland in North Queensland." Australian Journal of Ecology 23: 405-407.
Fensham, R.J. (1998). "Resolving biomass fluxes in Queensland woodlands." Climate Change Newsletter 10: 13-16.
Fensham, R.J., and Skull, S.D. (1999). "Before cattle: A comparative floristic study of Eucalyptus savanna grazed by macropods and cattle in North Queensland, Australia". Biotropica 31: 37-47.
Food and Agricultural Organisation (2005). (Viewed 14th March 2005)
Forestry Tasmania (2002). Giant Trees Policy.
Forestry Tasmania (2003). 2003 Sustainable Forest Management Report.
Geno, L. (1996). Keeping it Sweet, The Australian Conservation Foundation, Melbourne.
Hajkowicz, S., and Young, M. (2002). Value of Returns to Land and Water and Costs of Degradation. Final Report to the National Land and Water Resources Audit. CSIRO Land and Water, February.
Hanna, D., Gooday, P., Galeano, D. & Newton, P. (2005) Seafood Outlook to 2009-10 in Australian Commodities Vol 12 (1), Canberra.
Heggeler, S. (2004). "Prospects and Issues for the Australian Cotton Industry" In: Australian Bureau of Agriculture and Resource Economics (ABARE) Outlook Conference, March.
Hennessy, K., McInnes, K., Abbs, D., Jones, R., Bathols, J., Suppiah, R., Ricketts, J., Rafter, T., Collins, D. and Jones, D. (2004). Climate Change in New South Wales, Consultancy Report for the NSW Greenhouse Office, CSIRO and Australian Government Bureau of Meteorology, November.
Higgins, T.J., and Constable, G. (2004). "Development, Regulation and Use of Genetically Modified Crops in Australia", Farm Policy Journal 1(2): 14-22.
International Grains Council (2005). World Grain Statistics. London.
Johnston, A., Walker, D., Wood, A. (1997). "Spatial Analysis of the Impact of Land Use on Nutrient Loads in the Herbert River Catchment." SRDC Final Report -- Project CSC13S, Brisbane.
Kemp, D. (2003). "Murray Cod -- Matter of National Environmental Significance", Media Release 1st July, Minister for the Environment and Heritage, Canberra.
Larcombe, P. and Woolfe, K.J. (1999). "Increased sediment supply to the Great Barrier Reef will not increase sediment accumulation at most coral reefs", Coral Reefs 18: 163-169.
Larcombe, P. (2001). "Holocene Great Barrier Reef: sedimentary control and implications for environmental management". Geological Society of Australia Special Publication 21: 281-294.
LMC International (2004). Sweetener Analysis, Newsletter April 2004, Oxford.
Lomborg, B. (2001). The Skeptical Environmentalist: Measuring the Real State of the World. Cambridge University Press.
Lough, J.M., and Barnes, D.J. (2000). "Environmental control on growth of the massive coral Porites." Journal of Experimental Marine Biology and Ecology 245: 225-243.
Marohasy, J. (2003). "Deceit in the Name of Conservation". Review 55(1): 7-8. (Viewed 14th March 2005)
Neldner V.J., Fensham, R.J., Clrkson, J.R. and Stanton, J.P. (1997). "The natural grasslands of Cape York Peninsula, Australia. Description, distribution and conservation status". Biological Conservation 81: 121-136.
O'Donnell, V. (2005). "Agricultural Outlook to 2009-10". In Australian commodities Vol 12 (1) Canberra.
Reid, DD. J.H. Harris, D.J. Chapman (1997). NSW Inland Commercial Fishery Data Analysis, FRDC Project No. 94/027, December. Fish Research and Development Corporation.
Resource Planning Development Commission (2002a), Report on The Implementation of the Tasmanian Regional Forest Agreement.
Resource Planning Development Commission (2002b). Sustainability Indicators for Tasmanian Forests 1997 to 2001.
Seales, T., Gordon, S., Hafi, A., Toyne, C. (1999). Sugar: International Policies Affecting Market Expansion, ABARE Research Report No. 99.14, Canberra.
Smith, D.F. (2000). Natural Gain in the Grazing Lands of Southern Australia. Sydney: UNSW Press.
Southgate, D., D. Graham, and L. Tweeten. (forthcoming). Chapter 10, "Affluent Nations", in The World Food Economy. Oxford: Basil Blackwell.
Stark, W. (2003). Notes on GBR Rezoning, July. (Viewed 14th March 2005)
Walcott, J.J., Zuo, H., and Rath, H. (2004). Recent changes in Agricultural Land Use in Australia. The Regional Institute Ltd. (Viewed 14th March 2005)
Watson, I. (1991). Fighting over the Forests, St. Leonards, NSW: Allen & Unwin.
Wood, R.J. (2003). Myth and the Murray: Measuring the Real State of the River Environment. Backgrounder 15/5. (viewed 14th March 2005)
Wood, R.J. (2002). WWF Says "Jump!", Governments Ask "How High?" .
No comments:
Post a Comment