Address to the Australian Financial Review Housing Conference
9 March 2007
HOUSE PRICE TRENDS IN AUSTRALIA
The two most salient indicators of the housing market are the comparisons of median prices over time and the comparison of those prices in different Australian cities and in cities worldwide.
Using the HIA standardised price at 2006 prices for new houses and land, we can see the pattern shown in Chart 1.
Chart 1: Real House and Land Prices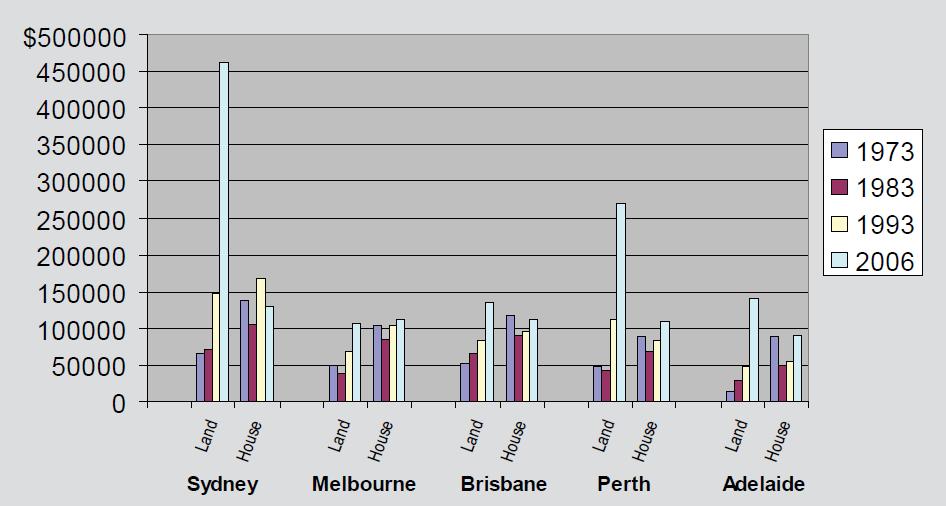 Sources: Sydney: REI of NSW; Melbourne, Brisbane and Adelaide: UDIA; WA: HIA.
The building component cost of new house prices has changed little in real terms since 1973.
Not so land supply. Since 1973 the price of the land component has outpaced general inflation by between tenfold (Adelaide, albeit from a low base) and threefold (Melbourne). Sydney, which has long experienced higher prices than elsewhere in Australia, saw an increase eight times greater than the overall rate of inflation over the period.
There is nothing predestined about these contrasting trends of stable building costs and escalating land prices.
Building costs have remained stable in spite of regulatory impositions, especially those concerning energy where recent 5-Star measures according to the industry increased cost by some $7,000 plus per home. The increased imposts placed on new housing raises its costs. As a result the value of existing housing increases. Such measures are therefore a means by which the incumbent home owners salve their consciousnesses about global warming, shortage of water and so on, at the expense of those without their own homes.
For house building there remains a relative ease of entry into an industry characterised by a highly efficient non-unionised sub-contracting structure. Both of these features are under some pressure by governments keen on promoting credentialism and disadvantaging the independent contractor over the unionised employee.
The industry itself has absorbed the regulatory cost imposts, though without them we would see modest but welcome reduction in house prices, and has to date successfully resisted continued government attempts to deem the "subbies" as employees and make them eligible for unionisation.
CROSS-COUNTRY COMPARISONS
In the case of land prices, Australian trends are seen in other but not all jurisdictions. Demographia publishes an annual survey of median house prices against median family incomes. The 2007 study examines 159 Anglosphere cities, dividing them into "affordable" where prices are under threefold the median family income and highly unaffordable where they are over 6.5 times the median family income. Forty two of the 159 fall in the affordable category and 25 fall in the highly unaffordable, with the rest in between.
Table 1: 25 Most Unaffordable Housing Markets
| # | Nation | Market | Median Multiple |
| 1 | United States | Los Angeles-Orange County, CA | 11.4 |
| 2 | United States | San Diego, CA | 10.5 |
| 3 | United States | Honolulu, HI | 10.3 |
| 4 | United States | San Francisco, CA | 10.1 |
| 5 | United States | Ventura County, CA | 9.4 |
| 6 | United States | Stockton, CA | 8.6 |
| 7 | Australia | Sydney | 8.5 |
| 8 | United States | San Jose, CA | 8.4 |
| 9 | United Kingdom | London (GLA) | 8.3 |
| 10 | United Kingdom | Boumemouth-Dorset | 8.2 |
| 11 | Australia | Perth | 8.0 |
| 12 | Unted States | Riverside-San Bernadino. CA | 7.9 |
| 13 | Canada | Vancouver | 7.7 |
| 14 | United States | Miami West Palm Beach, FL | 7.6 |
| 14 | United States | Modesto, CA | 7.6 |
| 16 | United Kingdom | Cardiff | 7.5 |
| 17 | United Kindom | Bristol | 7.3 |
| 18 | United States | Fresno, CA | 7.2 |
| 18 | United States | New York, NY-NJ,-CT-PA | 7.2 |
| 20 | Australia | Hobart | 7.0 |
| 21 | New Zealand | Auckland | 6.9 |
| 21 | United Kingdom | London Exurbs | 6.9 |
| 23 | Australia | Melbourne | 6.6 |
| 23 | United States | Sacramento, CA | 6.6 |
| 23 | United States | Sarasota, FL | 6.6 |
| 23 | Canada | Victoria | 6.6 |
Sydney, Perth, Hobart and Melbourne fall in the highest cost 25 and Brisbane falls just outside.
It costs over 6.6 median income levels to buy the median house in Australian cities. The average house requires only 3.2 years of average income in Canada, 3.7 years in the US and 5.5 years in Britain.
The fact is that house prices are highly conditioned by government policies -- if this were not so we would see a more consistent pattern of prices and price changes. Having established the facts we need to dig beneath them to find out what is driving the price changes.
DEMAND, SUPPLY, COSTS AND PRICES
In its "Inquiry into First Home Ownership 2004", the Productivity Commission understated the importance of supply constraints in pushing up prices. The report saw accretions to supply as being relatively low and therefore of limited influence in the market as a whole. In point of fact new house supply can respond quickly to increased demand and does so where land is not rationed. For example, in Houston, the vast expansion in demand that followed people leaving New Orleans after Hurricane Katrina placed only minor upward movement on house prices.
The PC also placed undue emphasis on the effect of new demand being dominated by people trading up in house value. This may in part be a consequence of land scarcity causing prices of new houses to be beyond the reach of first home buyers. More pertinently, it matters little who is buying the new property since if it is people trading up this should release stocks of existing houses and depress their prices.
Glaeser, Gyourko and Saks (2005) analysed housing costs in the context of different variables. They developed a proxy for regulatory restraints though noting that, "The very richness of the regulatory environment means that there is no one law or regulatory structure that would allow us to identify some metropolitan areas as being more onerously regulated compared with others". Their analysis indicated that in areas where the regulatory restraints were considerable the effect of a 10 per cent increase in demand led to a $60,000 price increase; in areas with lower levels of regulatory restraint, the increase was $5,000.
Some have argued that we are now seeing an overheated market that new demand cannot cope with. This view is difficult to sustain from the data. Commencements remain below the levels of the early 1990s and are considerably below those of the 1970s.
In NSW current levels at under 30,000 per annum compare with 50,000 in the early 1990s. Victoria was suffering from the Kirner ALP blues in that period but its present level at 30,000 is fewer than the 36,000 of 2002. Queensland in the early 90s and again in 2002 was starting 40-50,000, well above last year’s level and South Australia’s 11,000 compares with 14,000 in the early 1980s. Even Perth is commencing fewer dwellings than in the late 1980s.
Chart 2: Dwellings Commenced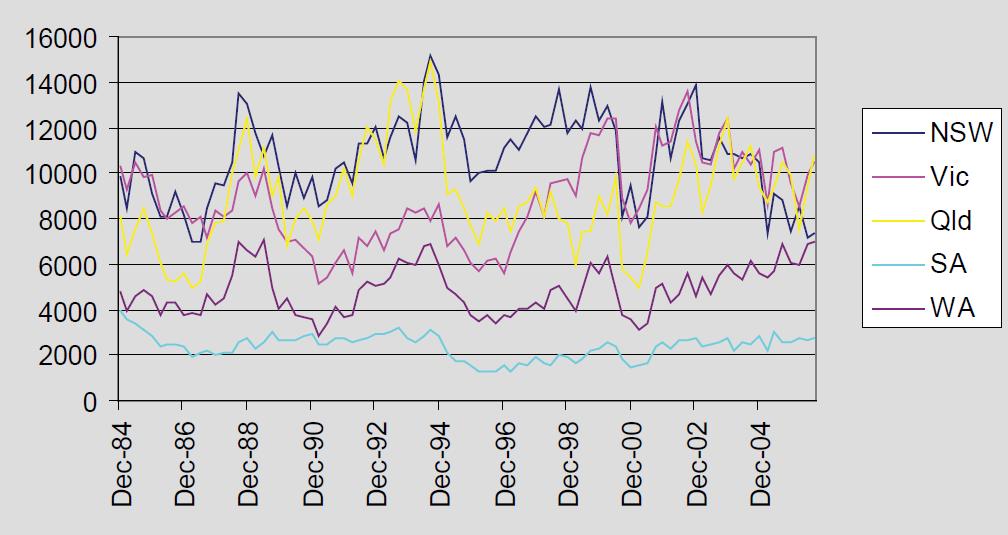
DWELLINGS COMMENCED
Charts 3-7 from the UDIA show how the price of new broadhectare housing blocks has risen over the past decade in the different Australian cities.
Chart 3: Adelaide Lot Supply v Ave. Price ($)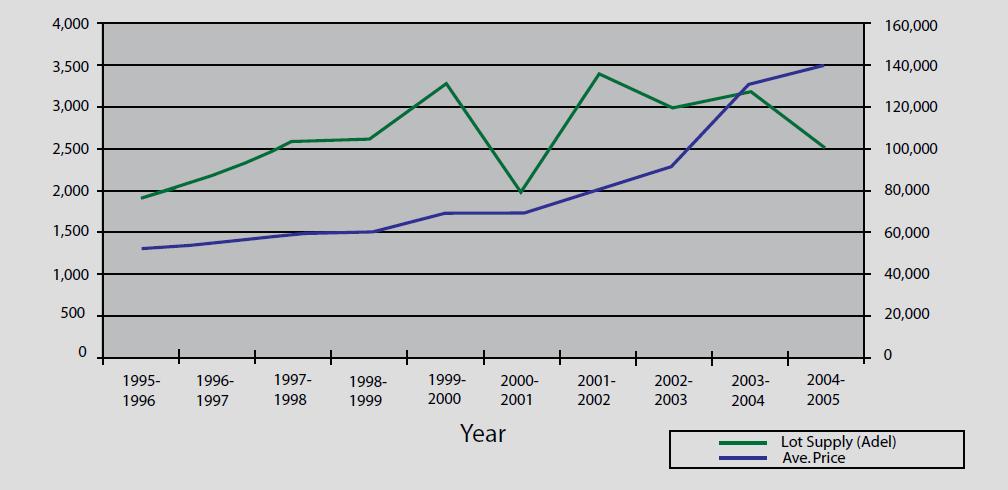
Chart 4: Brisbane Lot Supply v Median Price ($)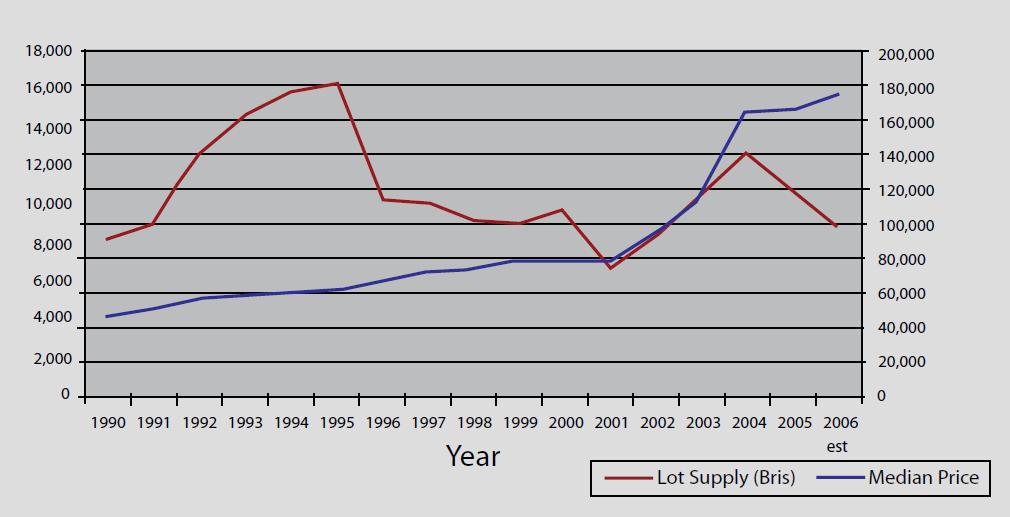
Chart 5: Melbourne Lot Supply v Ave. Price ($)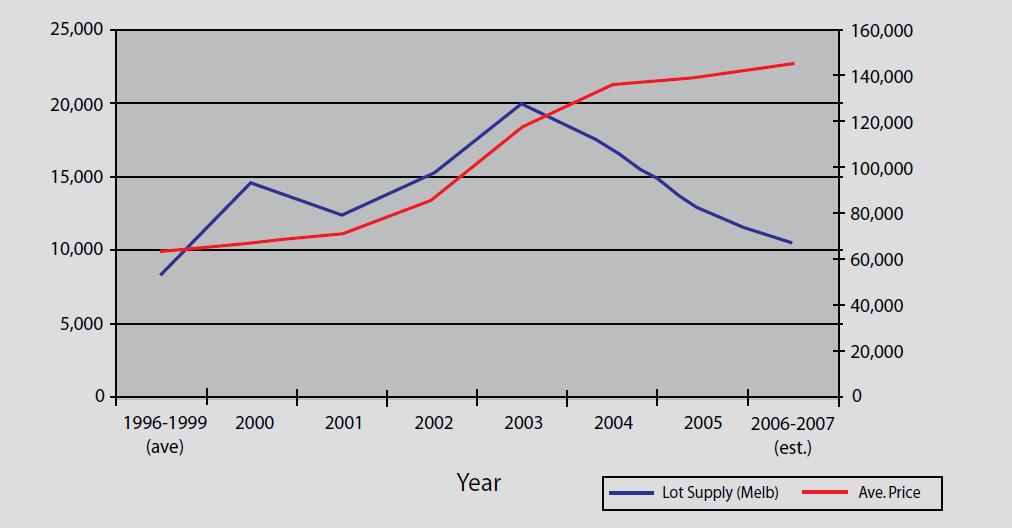
Chart 6: Perth Lot Supply v Ave. Price ($)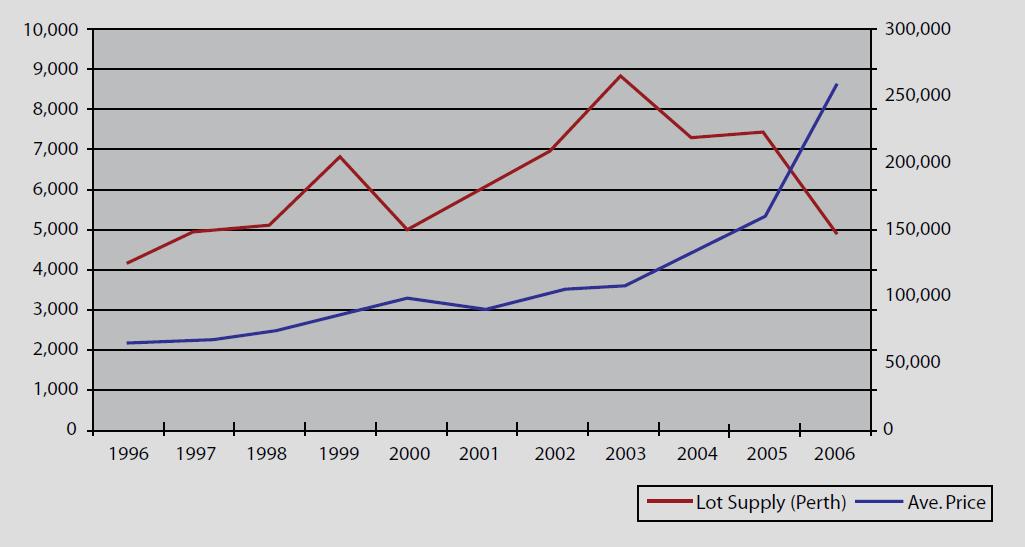
Chart 7: Sydney Land Supply v Ave. Price ($)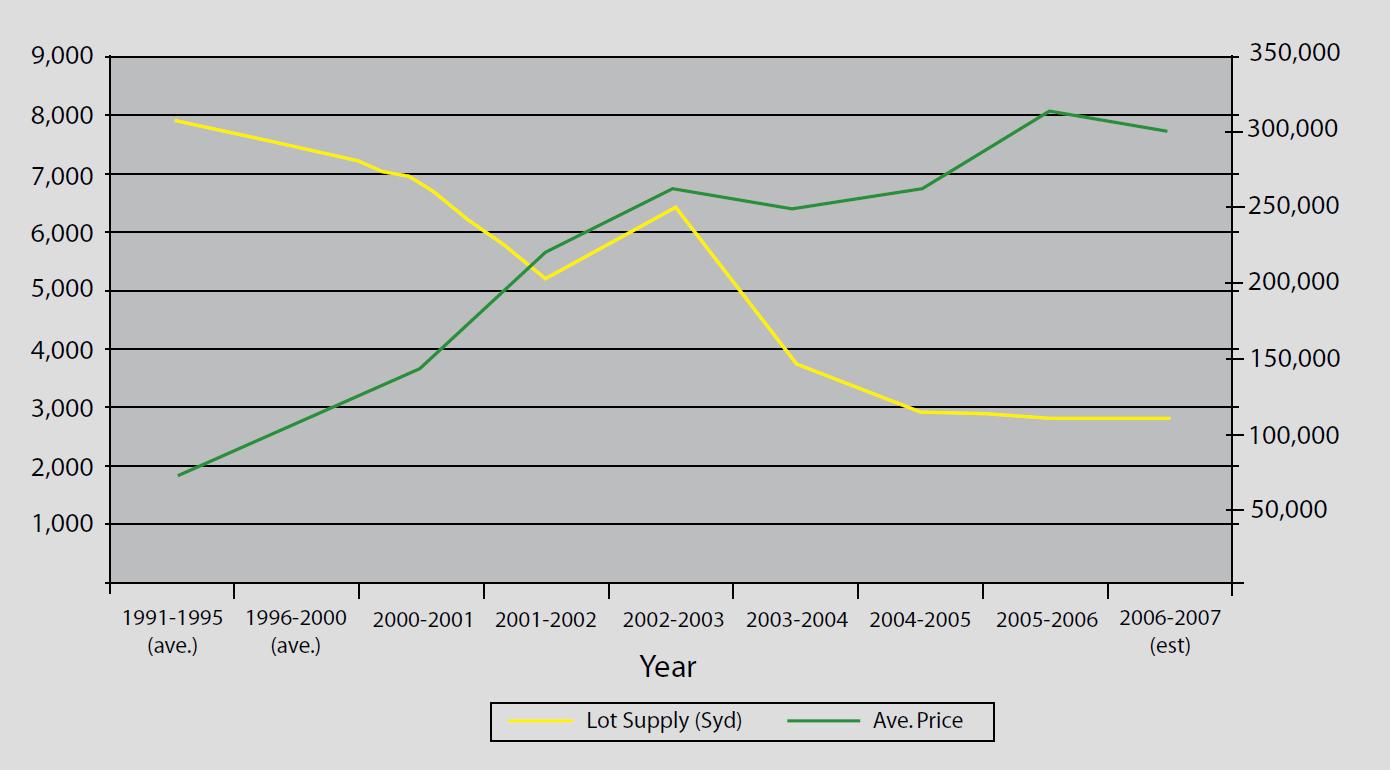
In Adelaide we can see the price rising precipitously especially as the supply headed south in the past year or so. A similar pattern is observed in Brisbane with prices surging from the year 2000 and lot availability actually falling. A similar fall in lot supply can be seen in Melbourne. And in Perth the picture is especially dramatic with lot supply almost halving in the past three years while prices more than doubled. Finally, Sydney is far and away the worst placed city -- an economy stagnating, house prices high and rising and land releases halving over the past decade.
The cost escalation is all about the land component. Land prices are high not because it is either expensive or time-costly to prepare land for development. Land can be brought on-stream in a matter of months once an approval is given. Preparing a piece of land for a housing development is not an expensive process.
The following shows costs per allotment in a South Australian development some 50 minutes from the Adelaide CBD. Total costs averaged $36,000 which with selling costs and so on might come to $45,000.
The virgin land in its normal usage as farmland is worth at most some $4000 per hectare and, even with the requirements for set asides, schools and other non-housing usages there are at least ten 600 square metre blocks per hectare.
These sorts of data demonstrate the fallacy in statements that maintain we must have a greater concentration of housing because preparing infrastructure outside of existing areas is exorbitant. Not only is the preparation of land not vastly expensive but it is by no means certain that urban renewal is cheaper than building on the fringe given the fact that all infrastructure in the end needs to be replaced. It is actually cheaper in a great many case to start anew rather than tear down and rebuild outdated or decaying infrastructure.
Some state housing and planning ministers claim there is an abundance of land available but that developers are hoarding it. This is not credible. There are dozens of developers and it would need collusion on a massive scale if they were purposely seeking to drive up prices.
The fact is that developers are planning their businesses years ahead and need a land inventory. They also face the problem of slow approval processes including sequential approval processes that can take a decade between land release and the ability to actually build on the land. Governments should be able to do something about this, much of which is caused by the accumulation of heritage, environment and other laws that they have introduced. Victoria is piloting an on-line clearance system which should be helpful in speeding up approvals.
In any event, if the problem is a reluctance of developers to prepare and build on land that has been released, that is easily resolved by releasing more land. There is no land shortage -- even in Sydney with its extensive national parks funnelling growth there is room for a million plus new homes on the Cumberland Plain alone. Less than 0.3 per cent (less than one per cent in Victoria) is urbanized, far less than the US areas where land releases are keeping pace with demand. An average sized block on the fringe of any Australian city would cost $50,000 if the government were to release more land for development. This compares with costs that are at least twice that and in Sydney and Perth several multiples of that.
There are those who argue that it is only demand that is forcing up house prices.
Macquarie Bank’s Rory Robertson is of this view. Mr Robertson thinks the reason why house price have gone up in some places but not others is because some places are "sexy". He defines these as those cities he likes: Australia is rather flattered by this perspective because all our capital cities are sexy. They are joined by US cities including New York, LA, San Francisco, and Honolulu, as well as British cities like London, Bournemouth (Fawlty Towers territory) and Cardiff (famous only when the Wallabies or All Blacks visit!). New Zealand, with Auckland also scores a heart as does Vancouver in Canada.
Those cities he evidently considers to be "dull" include bustling Toronto; Houston the world’s space industry capital; Cosmopolitan Quebec; Dallas, one of the premier energy and high-tech centres in the world. If people in these cities were aware of Hobart and Adelaide they could be forgiven a quiet snigger at having their cities compared unfavourable to those and perhaps other Australian cities. He also argues, "Important coastal cities are expensive everywhere". Presumably those that aren’t expensive -- including Halifax, Nova Scotia; Toronto (on a Great Lake) New Orleans and Melbourne (that’ll be Melbourne, Florida) as well as Houston, are not in Mr Robertson’s view "important".
Like Beauty, sexy and important is in the eye of the beholder. What really distinguishes cities that have affordable prices from other cities, sadly including all of Australian capitals, is the supply of land on which the authorities allow new houses to be built. Some cities like Houston, Dallas and Atlanta are kept affordable despite growing faster than any Australian cities.
Another element of demand that is often blamed for high house prices is interest rates. Interest rates are important for house prices but they will only inflate prices if supply cannot be increased. Other high value consumer durables like yachts, light planes, and Mercedes cars did not increase in price with lower interest rates. Just as in cities like Houston, Dallas, Atlanta and a host of others in the US, this was because supply is flexible and not regulated by government
The dominant factor for prices of housing in general is government created scarcity. Aside from taxes there are three factors in the price of a house: the cost of preparing the land, which with selling costs should not be more than $50,000 per block; the cost of building a house and we can open up any national weekend newspaper to find that this is anywhere from $110,000 to over $200,000. Finally there is the cost of the virgin land. The dominant use of such land is for farming and hardly any of it would sell for more than $4,000 per hectare. At 10 houses per hectare the virgin land cost is only $400; a trivial amount.
The artificially induced price escalation also has an effect in encouraging greater in-fill. This increased pressure has induced an amplified NIMBY presence and which has to a greater or lesser extent been successful in preventing "inappropriate development". This has tended to cut off an alternative, if inferior means of augmenting supply by more intensive development in existing urban areas.
TAXATION AND POSITIONAL SCARCITY
It is sometimes difficult to determine whether specific taxes add to prices or are absorbed by the supply chain.
In general taxes that comprise general charges like GST, stamp duty and land tax are in the main a further impost that the consumer pays. In this respect, the taxes boost the value of existing houses to the degree that the impost on these was originally lower.
Some other taxes probably get absorbed by the suppliers. This is likely to occur where government restrictions in land availability have created a scarcity and boosted land prices. In Sydney local and state wide specific infrastructure charges offer no value to the new house owner but are simply a convenient way of clawing back to the government some of the regulatory tax created by their policies in restricting land supply. Such charges in Sydney amount to $42,000-$83,000 per block.
The discussion of these costs should not overlook that some land and houses that are positioned well are likely to be more costly than others. And with higher levels of discretionary income, one might hypothesise that the more desirable places will see higher than average price increases. Even cities with no planning restraints like Houston have their $2 million houses. Doubtless, whatever is done about the availability of land on the fringe of Sydney would have only a minor effect on property prices in Rose Bay.
Table 2: Costs per allotment in Adelaide CBD
| Nature of cost | Cost per allotment |
| Civil works construction costs including: Establishment & Disestablishment Sedimentation Control Works Allotment filling Road Formation works Roads, pavements & gutters Hot-mix seal coat Stormwater drainage works Sewer reticulation Water reticulation Common Service Trenching ETSA/Telstra conduits materials Survey Certificate CITB levy | $30,415 |
| Sewer | $2,495 |
| Water Supply | $500 |
| Survey & Engineering | $3,000 |
| Planning, registration, title fees | $110 |
| TOTAL | $36,520 |
But this is immaterial to the main problem whereby artificially induced scarcity is boosting prices and resulting in excessive prices which ration supply. The losers are the first home buyers. Compared to previous years, the first home buyer on average in Australia faces a median house price at 6.6 times median household income levels. For decades this ratio was 3:1. The median household looking to buy their first home is likely to have a combined income under $90,000. This limits borrowing levels to $270,000, and little more than half of this with only one breadwinner. Denying young families the opportunity to own their own home constitutes a sever failure of public policy. This failure is even more acute when the solution to the problem is well-known.
No comments:
Post a Comment