Agenda, Volume 14, Number 1, 2007, pages 35-50
Land in Australia is more abundant than in almost any other country in the world and urban land, like rural land and mineral wealth, ought to be a component of the nation's comparative advantage. Urban land use, however, is subject to strict State or Territory Government regulation on the supply of land for housing. This increases land prices and housing costs. Restraint of land supply also has a significant impact on commercial activities like shopping centres. Regulatory limitations on the availability of land for shopping centres dampen competitive pressures and bring about higher retail prices.
Land costs are incorporated in most commercial activities. Hence, beyond the direct effects on housing and commercial property, measures that raise the price of land have a pervasive effect in raising costs throughout the economy.
An important by-product of regulatory-inflated land and housing prices is the consequential soaking up of savings that might otherwise be allocated to productive investment. A wind back of restrictions on land availability for home building and other urban uses would reduce housing prices and costs for land intensive urban activities as well as releasing savings for beneficial uses.
This paper examines the impact of urban development regulations on land and housing prices and explores the consequences for national savings and investment.
IMPACT OF REGULATIONS FOR URBAN
DEVELOPMENT ACTIVITIES
ZONING AND AUSTRALIAN HOUSE PRICES
Government restrictions on the production or sale of a product will invariably cause its price to rise. So it is with housing, where the availability of land for new housing is highly regulated.
Policies to introduce such restrictions are often motivated by ideological opposition to "urban sprawl", a concern that is particularly groundless in Australia where only 0.3 per cent of the land area is urbanised. Sometimes urban land rationing is based on (largely unfounded) claims that development beyond designated boundaries will add unduly to infrastructure costs. In point of fact, it is often cheaper to build infrastructure in greenfield areas than to renew it in existing urban areas; in any event, if house buyers are willing to pay the costs of infrastructure there should be no government concern.
In many cases, zoning restraints reflect a wish to prevent development in areas that have been set aside as park and recreational land. This is notably the case in Sydney, where Australia's most restrictive planning regime (and highest housing land costs) is in place.
Land use restrictions also stem from a wish to restrict outward development so that a denser metropolitan area is created. At a local level this goal is sometimes frustrated by opposition to high rise and similar development. Such opposition further accentuates the additional costs of the original program aimed at preventing urban spread and bringing greater population densities.
These pressures are reflected in prices. The Housing Industry Association (HIA) has estimated new land and house package costs over time. These are illustrated in Table 1, which, to allow meaningful comparisons standardises houses to a 135 square metre house and a 700 square metre block. New house prices are highly correlated with median prices of all houses.
Table 1: New Land and House Package Costs
| 1973 | 1983 | 1993 | 2006 | Price Increase Multiple 1973 to 2006 | |
| Sydney | |||||
| Land | $9,100 | $29,400 | $107,100 | $460,600 | 49.6 |
| House | $18,900 | $43,200 | $121,500 | $128,250 | 5.8 |
| Melbourne | |||||
| Land | $6,900 | $15,800 | $49,000 | $107,000 | 14.5 |
| House | $14,000 | $35,000 | $75,000 | $112,000 | 7.0 |
| Brisbane | |||||
| Land | $7,000 | $27,000 | $60,000 | $135,000 | 18.3 |
| House | $16,000 | $37,000 | $70,000 | $112,000 | 6.0 |
| Perth | |||||
| Land | $6,500 | $17,300 | $80,974 | $270,000 | 40.5 |
| House | $12,000 | $28,000 | $60,000 | $109,000 | 8.1 |
| Adelaide | |||||
| Land | $2,000 | $12,000 | $35,000 | $140,000 | 69.0 |
| House | $12,000 | $20,000 | $40,000 | $90,000 | 6.5 |
| CPI | 20.5 | 61.6 | 108.9 | 150.6 | 6.3 |
Sources: Sydney: REI of NSW;
Melbourne, Brisbane and Adelaide: UDIA;
WA: HIA.
The building component of new house prices has changed little in real terms since 1973, having risen little more than the average 6.3 times increase in the CPI. This is in spite of regulatory impositions, especially those concerning energy where recent measures according to the industry increased cost by some $7,000 plus per home (HIA 2005).
By contrast, since 1973 the price of the land component has outpaced general inflation by between tenfold (Adelaide, albeit from a low base) and threefold (Melbourne). Sydney, which has long experienced higher prices than elsewhere in Australia, saw an increase eight times greater than the overall rate of inflation over the period.
Property price increases may be expected to exceed general price increases in availability-limited high demand areas (the so-called "positional" goods, with harbour views or close to high fashion shops and so on). But there is no shortage of land for housing in general especially given the very small share of the national land stock that built-up areas comprise. Still less is there a land shortage for new houses which are overwhelmingly built on the urban fringe. It follows that changes in the demand for urban land are unlikely to have a significant effect on average price levels of land for housing. This is especially so since average land prices in its alternative farming use are only around $350 per hectare. At about 10 housing blocks per hectare, this represents a trivial component of the value of a house and land package.
In present day terms the costs of providing road, sewerage, water and other services to a new block of land in Australian outer urban areas is $40,000 to $60,000 in most places.
The costing for a new sub-division in South Australia just outside Adelaide's urban growth boundary is provided in Table 2. The blocks were offered at between $44,950 (for 400 square metres) to $58,950 (for 600-790 square meters) inclusive of holding costs, regulatory fees, sales costs and profits (Day, 2006).
Table 2: Land Allotment Costing
| Nature of cost | Cost per allotment |
| Civil works construction costs including: Establishment & Disestablishment Sedimentation Control Works Allotment filling Road Formation works Roads, pavements & gutters Hot-mix seal coat Stormwater drainage works Sewer reticulation Water reticulation Common Service Trenching ETSA/Telstra conduits materials Survey Certificate CITB levy | $30,415 |
| Sewer | $2,495 |
| Water Supply | $500 |
| Survey & Engineering | $3,000 |
| Planning, registration, title fees | $110 |
| TOTAL | $36,520 |
Source: Figures extracted from a 70 Allotment Stage for a development within the City of Onkaparinga with sales starting in mid 2006.
These figures are consistent with estimates prepared by UrbisJHD for the Property Council (2006) which examined 13 broadhectare subdivisions across Australia and put land preparation per unit in the range $26,600 to $60,000.
The value per block of land in excess of $60,000 is caused by regulatory constraints on availability. That value is an "economic rent". It does not represent real worth from an economy-wide perspective but is very important in terms of the distribution of wealth and income.
For land selling above these costs some of the economic rents that would otherwise accrue to landowners are captured by governments in "infrastructure charges". The average price of a block of land in Sydney, is estimated at $460,000 in 2006 (see Table 1, though it should be noted that to enable comparisons the average block size has been held constant and newer blocks tend to be smaller than the 700 square meters standard). The average Sydney block price incorporates some of these costs, representing stamp duty on land and contributions which UrbisJHD estimated to be at least $49,000.
In its Inquiry into First Home Ownership, the Productivity Commission (PC, 2004) understated the importance of supply constraints in pushing up prices. The report saw accretions to supply as being relatively low and therefore of limited influence in the market as a whole. In point of fact new house supply can respond quickly to increased demand and does so where land is not rationed. For example, in Houston, the vast expansion in demand that followed Hurricane Katrina placed only minor upward movement on house prices (Houston Chronicle 25 August 2006; H Pavletich, 2006, pers. comm., 27 August).
The PC also placed undue emphasis on the effect of new demand being dominated by people trading up in house value. This may in part be a consequence of land scarcity causing prices of new houses to be beyond the reach of first home buyers. More pertinently, it matters little who is buying the new property since if it is people trading up this should release stocks of existing houses and depress their prices.
Glaeser, Gyourko and Saks (2005) analysed housing costs in the context of different variables. They developed a proxy for regulatory restraints though noting that, "The very richness of the regulatory environment means that there is no one law or regulatory structure that would allow us to identify some metropolitan areas as being more onerously regulated compared with others". Their analysis indicated that in areas where the regulatory restraints were considerable the effect of a 10 per cent increase in demand led to a $60,000 price increase; in areas with lower levels of regulatory restraint, the increase was $5,000.
AUSTRALIAN HOUSE PRICES IN THE ABSENCE OF LAND PRICE INFLATION
In no Australian city can it be argued that space is itself a constraint in land availability. Sydney is sometimes cited as being hemmed in by mountains and national parks. Aside from the fact that the latter can be redefined, it is clear from an examination of the Cumberland areas out to Penrith and up towards Richmond that space is available for millions more houses — and there is the added possibility of development beyond the Blue Mountains.
The bottom line is that zoning restrictions are driving up land prices and housing costs. This is clearly evident from estimates of house prices based on the assumption that land prices had increased only in line with the general level of inflation; a not unreasonable assumption given the abundance of land and the experiences of jurisdictions in many US states and in Germany, which have not experienced accelerated land price inflation.
Clearly, had such regimes prevailed in Australia, the new house/land package would be considerably reduced. In Sydney, had land prices increased in line with general inflation, this would have meant house/land packages in 2006 at $185,000 rather than the actual $588,850; for Melbourne the respective numbers would have been $155,470 rather than $219,000; for Brisbane they would have been $156,100 rather than $247,000; for Perth $150,000 rather than $379,000; and for Adelaide $102,600 rather than $230,000. Table 3 illustrates this.
Table 3: Typical New House Prices in Capital Cities
| 1973 | Actual 2006 | Increase 1973 to 2006 | Excluding 1973 | Inflated 2006 | Land Prices Increase 1973 to 2006 | |
| Sydney | ||||||
| Land | $9,100 | $460,600 | 50.6 | $9,100 | $57,330 | 6.3 |
| House | $18,900 | $128,250 | 6.8 | $18,900 | $128,250 | 6.8 |
| Total | $28,000 | $588,850 | 21.0 | $28,000 | $185,580 | 6.6 |
| Melbourne | ||||||
| Land | $6,900 | $107,000 | 15.5 | $6,900 | $43,470 | 6.3 |
| House | $14,000 | $112,000 | 8.0 | $14,000 | $112,000 | 8.0 |
| Total | $20,900 | $219,000 | 10.5 | $20,900 | $155,470 | 7.4 |
| Brisbane | ||||||
| Land | $7,000 | $135,000 | 19.3 | $7,000 | $44,100 | 6.3 |
| House | $16,000 | $112,000 | 7.0 | $16,000 | $112,000 | 7.0 |
| Total | $23,000 | $247,000 | 10.7 | $23,000 | $156,100 | 6.8 |
| Perth | ||||||
| Land | $6,500 | $270,000 | 41.5 | $6,500 | $40,950 | 6.3 |
| House | $12,000 | $109,000 | 9.1 | $12,000 | $109,000 | 9.1 |
| Total | $18,500 | $379,000 | 20.5 | $18,500 | $149,950 | 8.1 |
| Adelaide | ||||||
| Land | $2,000 | $140,000 | 70.0 | $2,000 | $12,600 | 6.3 |
| House | $12,000 | $90,000 | 7.5 | $12,000 | $90,000 | 7.5 |
| Total | $14,000 | $230,000 | 16.4 | $14,000 | $102,600 | 7.3 |
| CPI | 20.5 | 150.6 | 6.3 | 20.5 | 150.6 | 6.3 |
Source: Derived from HIA (2006) Standardised to a 135sqm house and a 700 sqm block.
EFFECTS OF ZONING REGULATIONS ON OTHER TYPES OF PROPERTY
Not only does land rationing mean higher prices for housing but there is an effect on all other activities. Inflated land costs are likely to have particular importance in land intensive industries, including shops and hotel accommodation.
In the case of hotels, the land component of cost varies with a number of factors, notably the hotel's residential standard. For budget hotels in Sydney and Melbourne, industry sources estimate the land component of total costs to be approximately 20-25 per cent. For high end accommodation, the land component would be under 10 per cent. The implications of land price inflation for these hotels would also entail a doubling of land costs and charges 10 to 20 per cent above the unrestricted market rate for budget and high end accommodation respectively. This is likely to bring about misallocations of income, in the case of hotels, by reducing activity in the tourism market.
Similar issues are apparent in the case of shops and other commercial premises. These facilities share a further cost penalty as a result of locational requirements and planning arrangements that are designed to prevent competition between centres. City planners offer shopping centres protection from new centres unless a need for such a centre can be "proved". The deliberate curtailment of competitive pressures has tended to be circumvented by a modern trend to "direct factory outlet" stores often sited in low cost locations close to good road links. The regulatory authorities have therefore extended their planning restraints to these new forms of retail outlets and opposed their development.
The locational objections to these regulatory measures are twofold. First commitments made to shield incumbent developers from competition may have entailed quid pro quos in terms of additional costs imposed upon the incumbent centres, such as making bus service space available and ramps for the disabled etc. They may also have involved political contributions in cash or kind. Second, there is a strong regulatory push to ensure people without car access are not "disadvantaged" by shop locations that are not well served by public transport.
The outcome of retail competition restraints is retail prices that are higher than they should be. Some evidence of this was developed by Baker (2004) from the UrbisJHD consultancy. This reveals that Australia is under-provided with shops compared with the most liberal jurisdiction, the US. This restraint on shopping space in Australia brings higher prices. Baker (2004), for example, found occupancy costs in US regional shopping malls to average 13 per cent of sales, versus 16-17 per cent in Australia (see Table 4).
Table 4: Shopping Centre and Total Retail Space
| Country (year) | Shopping Centre | Retail Space |
| (Square foot per capita) | ||
| United States (2003) | 20.2 | 39.2 |
| New Zealand (2000) | 4.3 | 25.8 |
| Australia (2003) | 6.4 | 20.4 |
| United Kingdom (200) | 3.2 | 14.0 |
| Hog Kong (2003) | N.A. | 12.9 |
| South Korea (2002) | N.A. | 12.9 |
| Singapore (2003) | 4.3 | 10.8 |
| Canada (2003) | 12.8 | N.A. |
| Japan (2002) | 3.2 | 10.8 |
Source: Baker (2004).
There are additional knock-on effects. The Productivity Commission (2006) recognised one such effect in its report on airport charges. Because most Australian airports were originally under Commonwealth rather than State control, they benefit from less stringent planning restraints than those on nearby land. Having been privatised, airports have moved to rent their surplus land for retail and commercial activities without requiring state government approval to do so. New retail facilities at airports, especially in the form of "Direct Factory Outlets", have moderated the price increases brought about by governments' restraint of competition. This also boosts the value of the airports' land and puts upward pressure on airport charges. The higher value of the land for uses other than those traditionally associated with airports will eventually lead to modifications in airport owners' business plans if higher charges associated with aircraft activities are not permitted to rise in line with the increased land value.
EFFECT OF LAND REGULATION ON
CONFIDENCE IN POLITICAL PROCESSES
A further manifestation of regulatory restraint and its political approval process is that it can lead to the abuse of government powers. Such abuse is invariably to the detriment of consumers and rate payers. Strawman (2006) highlights an alleged recent example of such abuse (see accompanying box).
The ACT government owns all land and keeps land prices artificially high by refusing to release more land. When the government does release more land, it zones it for a particular purpose -- not just "residential" or "commercial", but it dictates the detail (for example, the type of commercial activity allowed). However, it can be quite vague about that use. Canberra Land developer Terry Snow has his 99 year lease for Canberra Airport with the Commonwealth government, and is immune from the whims of the ACT development laws within the airport grounds. When Snow decided to build a retail outlet on the Airport the local politicians had two internally contradictory arguments against it
A 7ha tract of land in the nearest industrial estate (Fyshwick) was auctioned for "bulky goods". Snow was unable to clarify exactly what was meant by that. He was outbid on the land by one of his rivals, and the government has now decided that it can be used for "retail". The site was independently valued at around $12 million (for bulky goods), it went for $39 million (when Snow pulled out of the bidding), and Snow says that, as a retail site, it was worth around $100 million. |
The government action has brought a claimed unnecessary cost of some $60 million to the community, a cost that would be incurred either in the form of higher local taxes (comprising the rental saving of $60 million) or higher than necessary prices for the goods and services sold at retail throughout the area.
The quite massive economic rent achievable in obtaining approval to develop a piece of land puts political integrity at risk. When land can be transformed in value from a few hundred dollars per hectare to hundreds of thousands of dollars simply by obtaining a changed regulatory status, the scope for corruption is clear.
Though the ACT Auditor-General found no evidence of unfairness or preferential treatment, she did note weaknesses in coordination between two government agencies that prevented "efficient and effective services to the parties". The Auditor-General's report left many parties dissatisfied including the Shopping Centre Council of Australia.
At the very least, the rewards from changing the planning status of land justify an inordinate amount of deadweight costs in lobbying and other paper-burden activity. At worst the potential rewards from gaining regulatory favours can undermine integrity and trust in political processes when people observe favours being bought and sold for development approvals.
Duffy (2006) has put the issue with great clarity in discussing Sydney:
The relationship between this state's developers and its government is a key element of what might be called the political business model. Developers appear to pay political donations to government to get the access they need to stay in business. According to the Greens' website, democracy4sale.org, this makes developers the largest donor group by far after the unions. ...
In practice, thanks to policies such as urban consolidation, zoning is one of the last examples of the rationing of something many people desperately want. Whenever this occurred in the past, as with bans on gambling or various forms of sexual behaviour, corruption resulted. In the 1960s people had to pay off politicians if they wanted to run a casino. Now it appears as if they have to pay political donations to build almost anything.
WIDER MACRO-ECONOMIC EFFECTS
HOUSING AND REAL LEVELS OF SAVINGS
The Commonwealth Treasury (2005) assembles and publishes annual data on the wealth of Australian households. Treasury notes that private wealth is important as a measure of the stock of future spending power (and therefore of real living standards) and is a major factor in future consumption levels. It argues:
The change in real net wealth of households from one period to the next is the pure economic definition of saving. Therefore, the annual change in real private sector wealth can be interpreted as the annual economic saving of the private sector.
Treasury estimates aggregate Australian private wealth in 2005 nominal dollars at $6,076 billion or $305,500 per person. In real 2003/4 dollars, as Figure 1 shows, overall wealth is estimated to have grown fourfold since 1975. In per capita terms the real growth has been two and a half fold during the same 30 year period.
Figure 1: Estimated Australian Real Aggregate Wealth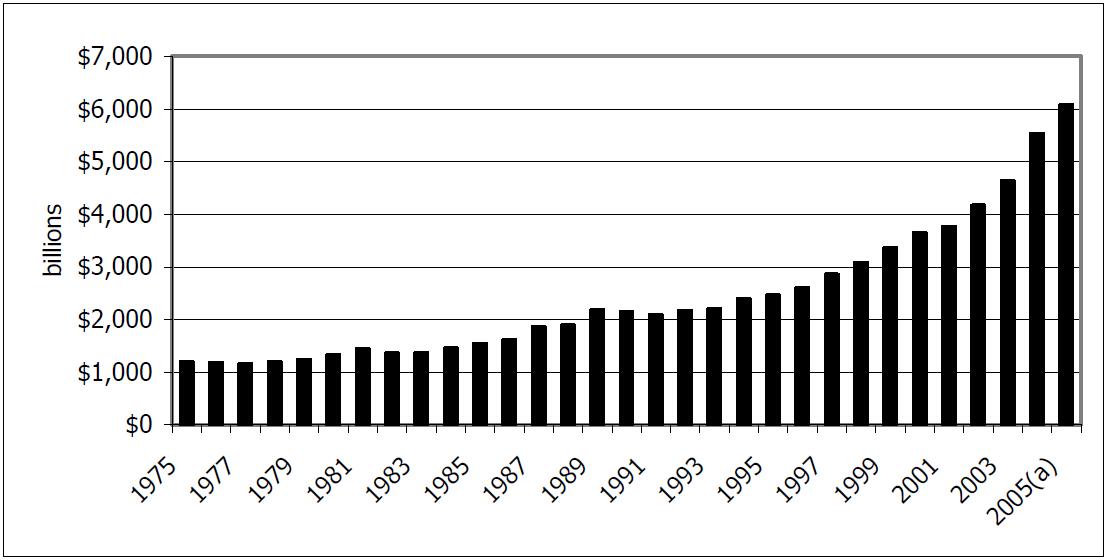 Note: a = preliminary figures
Source: Commonwealth Treasury (2005:Table A3)
Treasury's equating of savings and the change in real wealth is misleading. As a result of asset price inflation exceeding overall inflation, real wealth is overstated. Private wealth is dominated by housing which in 2005 comprised 58 per cent of the total. This has increased from 50 per cent in 1975. The next largest share, comprising one third of the total, was business assets. A proportion of these would also be represented by real estate.
The various components of private wealth (excluding foreign debt) are illustrated in Figure 2.
Figure 2: Asset Composition of Australian Households, 2005 Source: Commonwealth Treasury (2005:92, Chart 3)
AGGREGATE LEVELS OF WEALTH CORRECTED FOR LAND INFLATION
If overall land and house prices based on Table 1 were deflated so that the land component increased only at the level of the CPI, this would show a more accurate picture of aggregate real wealth changes. Using such a methodology, Table 5 shows the overall increase in new house and land packages, which are closely correlated existing land and house packages. The state based price increases 1973-2006 are shown together with the price increase over and above the general level of inflation.
Table 5 Actual and Normalised New House/Land Prices
| 1973 | 2006 with land inflation at average levels | Actual 2006 | Excess inflation | |
| Sydney | $28,000 | $185,580 | $588,850 | 2.17 |
| Melbourne | $20,900 | $155,470 | $219,000 | 0.41 |
| Brisbane | $23,000 | $156,100 | $247,000 | 0.58 |
| Perth | $18,500 | $149,950 | $379,000 | 1.53 |
| Adelaide | $14,000 | $102,600 | $230,000 | 1.24 |
Source: HIA and ABS
In Table 6 the data from Table 5 is weighted to derive the mean of the price increases experienced in the capital cities. Over the nation as a whole, if land price inflation in the capital cities is typical the apparent worth of houses is boosted by approximately 122 per cent.
Table 6: Weighted Mean Price Increases in Capital Cities 1973-2006
| Sydney | Melbourne | Brisbane | Perth | Adelaide | Total | |
| Population share | 0.350 | 0.280 | 0.210 | 0.085 | 0.075 | 1.00 |
| Excess inflation | 2.17 | 0.41 | 0.58 | 1.53 | 1.24 | 1.22 |
Some further adjustment to the data would bring it to a 1975-2005 basis. This involves taking into account the price rises 1973-1975 (when housing prices inflated by 36.5 per cent) and in 2006 (when prices increased by 7 per cent). However, in the event house price inflation in the three bookend years was not significantly from aggregate inflation levels.
Applying the 1.22 correction to the Treasury estimates shown in Figure 1 reduces the per capita value of housing wealth in 2005 from $175,036 to $79,600 when stripped of the excess inflation since 1975. (The comparable 1975 value is $44,300.)
In terms of aggregate estimated real wealth per capita, reducing the component of that identified as housing to extract the price premium created by regulatory induced scarcity from the Treasury estimate brings a decline in the real level of wealth from the stated $305,000 to something of the order of $200,000.
LAND PRICE INFLATION AND SAVINGS IN OECD COUNTRIES
In Germany (Demographia, 2006; Evans and Hartwich, 2005) and the many American urban areas that do not have restrictive zoning laws for developable land, house land prices have remained stable in real terms. This confirms expectations based on conventional economic analysis that zoning restrictions are responsible for an artificial land scarcity and the consequential price escalation.
Inter-country comparisons offer some evidence that zoning restraints and the associated housing land inflation tend to result in a different picture of household savings ratios than that seen in Australia and other jurisdictions where zoning policy is creating land rationing and land price inflation. Hiebert (2006) looking at cross country data finds:
(In) Australia, Canada, the UK and the US ... a casual inspection suggests that the co-movement of asset price valuation and private saving has been particularly striking. ... These countries have had relatively similar experiences over time with regard to asset price developments, propensities to incur debt and access to credit. Moreover, it is likely that households in these countries have relatively similar attitudes vis-à-vis homeownership versus renting along with many similarities in pension schemes.
Hiebert cites several studies that have examined the effects of asset price inflations and savings levels. These include two that used a household wealth measure (de Serres and Pelgrin, 2003; de Mello, Kongsrud and Price, 2004) which found strong evidence of offsetting movements in private and public saving (or dissaving).
EFFECTS ON AUSTRALIAN SAVINGS AND INVESTMENT
The clear evidence that true levels of wealth, without regulatory induced land price inflation, are rather lower than indicated by official figures has major policy implications. The published estimates are likely to encourage government overconfidence about the level of aggregate household wealth, this has consequences for wealth (and income) distribution. In turn, wealth and income distribution have corollaries for the productivity of the economy.
Rationing land available for urban development purposes boosts the worth of land which has already been built upon or has been designated for such use. The value of the land allows people who have homes the comfort of an asset worth far in excess of its original cost. When considered in a nation wide perspective, the illusory nature of a large share of that apparent wealth is obvious from the fact that it is derived from a contrived, regulation-stimulated scarcity.
In the case of long-standing home owners, the wealth transfers resulting from the regulation-induced reorganisation of asset values are likely to bring an even greater misallocation than that posited for non-home owners. In Australia, around two thirds of home owners have either no mortgage or have paid off a substantial part of their mortgages. For those who have considerable equity in their own home, the escalated level of wealth they enjoy would be likely to encourage a greater level of consumption than they would otherwise regard as prudent. Thus, asset value reorganisation would be likely to induce diversion of income from savings (and therefore from investment) as a result of the apparent high levels of wealth embodied in the stock of housing.
There is no clear evidence on the amount diverted to consumption. According to survey work undertaken by the Reserve Bank (Hampton et al, 2006), withdrawals from house equity into direct consumption comprised only 17.6 per cent of the total in 2004. A further 7.6 per cent might have indirectly been so diverted in that it comprised repayment of other debt, while some of the monies lodged as deposits (33 per cent of the total) might also have eventually been spent in areas other than asset accumulation. Only about 25 per cent (superannuation, business and investments) could be said unambiguously to be reinvestment.
Table 7 reproduces the key data assembled by the Reserve Bank.
Table 7: Direction of Funds Withdrawn from Home Equity
| Non-transactors | Property transactors | All methods | ||||
| Share of all households | Share of value withdrawn by this method | Share of all households | Share of value withdrawn by this method | Share of all households | Share of total value withdrawn | |
| Per cent | ||||||
| Household Expenditure | 3.4 | 29.7 | 0.7 | 13.0 | 4.0 | 17.6 |
| Of which: | ||||||
| Redecoration/ durables etc | 1.5 | 13.0 | 0.3 | 6.9 | 1.8 | 8.6 |
| Car | 1.3 | 12.0 | 0.2 | 3.6 | 1.5 | 5.9 |
| Holiday | 0.5 | 2.9 | 0.2 | 1.3 | 0.6 | 1.7 |
| Living Expenses | 0.1 | 1.8 | 0.1 | 1.2 | 0.2 | 1.4 |
| Asset accumulation | 1.6 | 41.0 | 2.3 | 65.2 | 3.9 | 58.5 |
| Of which: | ||||||
| Deposits | 0.6 | 18.6 | 1.3 | 38.6 | 1.9 | 33.0 |
| Superannuation | 0.0 | 1.5 | 0.2 | 5.8 | 0.2 | 4.6 |
| Household business | 0.3 | 4.9 | 0.1 | 2.0 | 0.5 | 2.8 |
| Commercial property | 0.1 | 5.9 | 0.1 | 0.4 | 0.1 | 1.9 |
| Other non-property investments | 0.5 | 10.2 | 0.6 | 18.4 | 1.2 | 16.1 |
| Repay Other Debt | 0.7 | 8.3 | 0.4 | 7.4 | 1.2 | 16.1 |
| Other | 0.6 | 4.6 | 0.4 | 7.1 | 1.0 | 6.4 |
| Cannot say | 1.1 | 16.4 | 0.6 | 7.3 | 1.7 | 9.8 |
| Total | 7.3 | 100.0 | 4.4 | 100.0 | 11.7 | 100.0 |
Notes: Components may not sum due to rounding, and calculations involve some imputation. Also, for each household, the full value of withdrawn equity has been apportioned to the specific main use of funds.
Source: Schwartz et al (2006)
Several studies have examined the effect of housing wealth on real levels of consumption (and hence income). Bostic, Gabriel and Painter (2006) found that a $100 increased housing wealth brought an annual increase in consumption of $6 (that is, the elasticity of consumption spending with respect to housing wealth was 0.06).
While wealth increases are certain to bring about consumption increases (and vice-versa) dissembling such increases between their real and nominal features is essential if they are to be used in macro-economic analysis. Indeed, the selective wealth effect created by regulatory induced land price inflation is likely to bring about a changed allocation between national expenditure on consumption and investment. Those benefiting from the "windfall", like those winning a lottery, are more likely to engage in consumption expenditures than investment expenditures.
This diversion of domestic savings from productive investment has doubtless been important in two related trends.
One of these is the increased share of foreign savings in total savings. Represented by the deficit on the current account of the balance of payments, foreign savings have grown from a previous average level of two per cent of GDP to comprise five per cent or about 20 per cent of domestic investment. Foreign lending and equity represent future claims on output. Capital inflow trends are illustrated in Figure 3.
Figure 3: Current Account Deficit as a Share of GDP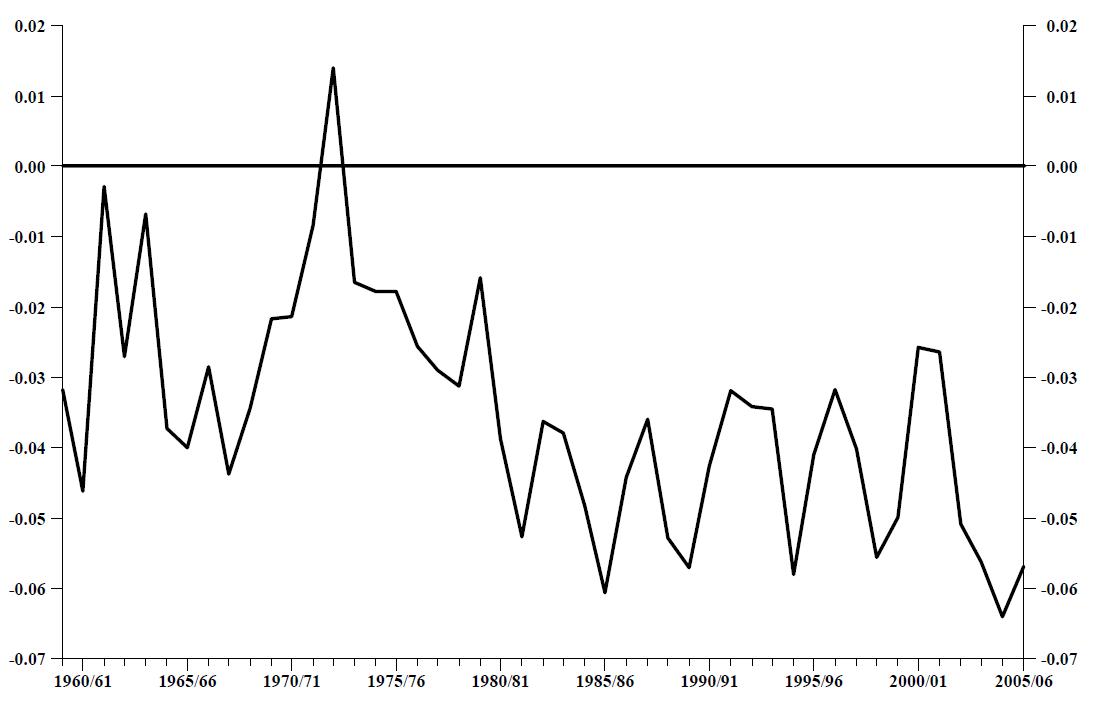 Source: Australian Bureau of Statistics (2006)
A diversion of savings form productive investment may also have influenced the trend in investment growth. Between 1985 and 1995 this was subdued. Investment growth was again relatively low between 1998 and 2003 but has since increased considerably. Following an upturn in economic growth driven by the mid 1990s investment surge, privatizations, and reforms to industrial relations and competition policy from the mid 1990s, Australia's economic performance has slowed since 2003. A lift in investment since then may have provided fuel for a further growth spurt. The diversion of savings into house/land packages would clearly be influential in overall levels of investment. And although there has been an increase in investment since 2003 as Figure 3 indicated, much of this is provided by an increase in overseas savings. Figure 4 shows recent investment in plant and equipment.
Figure 4: Real Private Investment in Plant and Machinery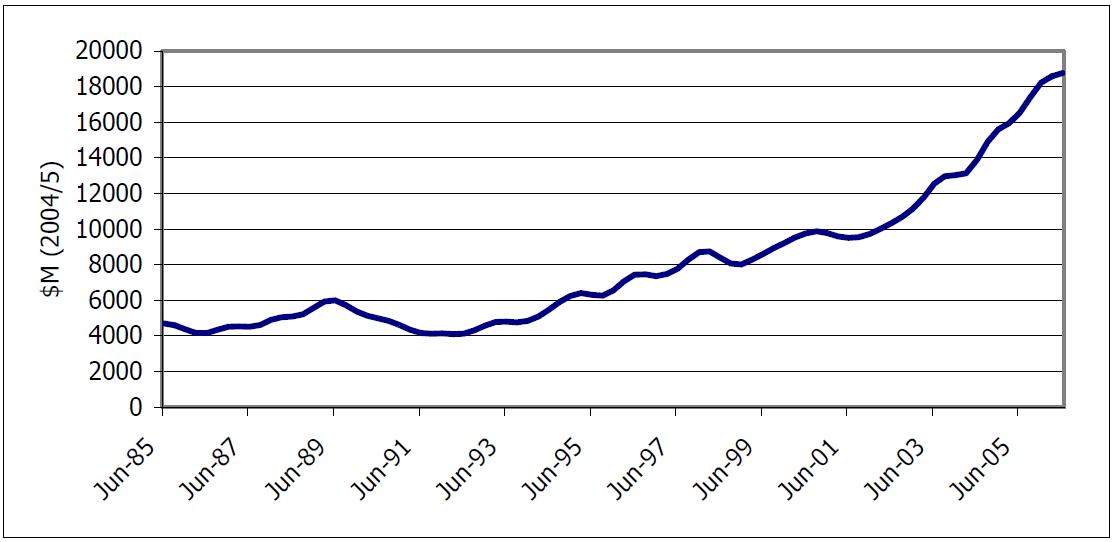 Source: Australian Bureau of Statistics (2006)
The diversion of savings into house/land packages may also be having an effect in reducing overall levels of investment. As such this is likely to have been a major cause of the productivity slowdown Australia has experienced since 2003.
CONCLUDING COMMENTS
Planning laws that have socialised land ownership, and have transformed its value into one dominated by regulatory favours — land which is designated for urban development is increased in value tenfold and more. The value of the land on which prospective new housing development stands is dominated by government created shortage and rationing of development approvals. Regulation of land for new housing stems from many factors, perhaps the chief among which is a concern about urban sprawl. This is especially misplaced in Australia which has by far the lowest population density of any major country in the world. Regulation of land for new housing is fuelling higher prices for all similar priced homes. This is reducing the prospects of home ownership for those not presently owning their own home.
Regulation that restrains the availability of urban land also has a more pervasive effect on the economy. It diminishes the availability of savings for productive investment, since savings are diverted to expenditures on housing the value of which is inflated by government created scarcity.
The solution is for a liberalisation of planning approvals. Initially this may have to be gradual as many individuals and businesses have taken investment positions in the context of the government created scarcity and would suffer considerable financial distress if the regulatory basis for their decisions were abruptly unwound. Beyond a transition period, the development approval process must be reversed from one that allows urban development only when the authorities permit it to one that forbids such development only in exceptional cases.
REFERENCES
Australian Bureau of Statistics (2005), Australian System of National Accounts 2004-2005, cat. no. 5204.0, ABS, Canberra.
Australian Bureau of Statistics (2006), Australian National Accounts: National Income, Expenditure and Product, Jun 2006, cat. no. 5206.0, ABS, Canberra.
Baker, M. (2004), "Shopping Center Industry Benchmarks", ICSC Research Review 11(3):5-6.
Bostic, R., S. Gabriel and G. Painter (2006), "Housing Wealth, Financial Wealth, and Cconsumption: New Evidence from Micro Data", Lusk Center for Real Estate, University of Southern California (retrieved 30 October 2006).
Commonwealth Treasury (2005), "Australian Net Private Wealth"
Day, B. (2006), personal communication, 29 August.
de Serres, A. and F. Pelgrin (2003), "The Decline in Private Saving Rates in the 1990s in OECD Countries: How Much Can Be Explained by Non-Wealth Determinants?", OECD Economic Studies 36(1):117-153.
de Mello, L., P. Kongsrud and R. Price (2004), "Saving Behaviour and the Effectiveness of Fiscal Policy", OECD Economics Department Working Paper No. 397.
Demographia (2006), 2nd Annual Demographia International Housing Affordability Survey 2006 (retrieved 30 October 2006).
Duffy, M. (2006), "Payola: A State-sanctioned Business Model", Sydney Morning Herald, 12 August.
Evans, A. and O. Hartwich (2005), Bigger, Faster, More, Policy Exchange, London.
Glaeser, E., J. Gyourko and R. Saks (2005), "Urban Growth and Housing Supply", Harvard Institute of Economic Research, Discussion Paper No. 2062 (retrieved 30 October 2006).
Hiebert, P. (2006), "Household Saving and Asset Valuations in Selected Industrialised Countries", Research Discussion Paper, Reserve Bank of Australia (retrieved 30 October 2006).
Housing Industry Association (2005), "Submission to the Taskforce on Reducing the Regulatory Burden on Business".
Housing Industry Association (2006), "Typical New House and Land Packages by Capital City, 1973-2006" (retrieved 30 October 2006).
Productivity Commission (2004), Inquiry on First Home Ownership (retrieved 30 October 2006).
Productivity Commission (2006), Review of Price Regulation of Airports Services (retrieved 30 October 3006).
Property Council (2006), Residential Development Cost Benchmarking Study, Sydney.
Schwartz, C., T. Hampton, C. Lewis and D. Norman (2006), "A Survey of Housing Equity Withdrawal and Injection in Australia", Research Discussion Paper RDP2006-08, Reserve Bank of Australia.
Strawman, 2006, "Snow Frozen out of Fyshwick in Stinky Land Deal", retrieved 30 October, 2006, (reference: 2006-07-09.10:18).
Urbis JHD (2006), "Residential Development Cost Benchmarking Study", Prepared for the Property Council of Australia, March.
I would like to acknowledge the help of Harley Dale at the HIA Economics Group for help in assembling the Australian data.
No comments:
Post a Comment