Occasional Paper
INTRODUCTION
What if an election was held and all that was offered was tax cuts? During this election campaign both parties have promised to increase government spending. Meanwhile, as all of these promises to spend more have been gradually accumulating, the various state, territory and federal governments have actually spent more than $1 billion on each day of the campaign. No matter who wins Saturday's election, this $1 billion-plus per day habit is set to continue into the foreseeable future.
In this brief we evaluate how deep the tax cuts would have been had the parties chosen to cut more and spend less. The Federal Government has been running a small surplus of about one percent of GDP over the past few years. This is now a bipartisan policy, and provides the illusion that each party is being fiscally responsible as possible. To be sure, having a surplus is better than having a deficit; yet much more could be done, particularly on tax cuts.
This election campaign started out promisingly, with both major parties announcing tax cuts during the first week. Each party also announced aspirational targets for further tax cuts. This was a welcome change to the standard pattern of Australian election campaigns, which usually only involve new spending commitments. It is not clear that all of these tax cuts will actually be delivered, but an important precedent has now been established in Australian politics: political parties can aspire to cut taxes as an integral part of their campaign strategies.
This is progress. Chart 1 below shows quite clearly that the overall (federal, state, and local government) Australian tax burden has increased dramatically since 1980, and especially since 1992.
Chart 1: The Australian Tax Burden
Total Government Revenue as a % of GDP Source: OECD Revenue Statistics
WHAT IS ON THE TABLE?
It is not easy to determine the actual dollar amounts of election campaign spending promises. Political parties have an incentive to fudge the numbers either up or down, depending on who is listening. Politicians want to look like big spenders when they visit a marginal seat, but on national television they want to appear as spendthrifts.
The standard tactics have been evident throughout this campaign. Money that has been budgeted to be spent -- but not yet allocated -- has been re-announced. Money that has been committed to be spent before the election campaign is often repackaged and announced during the campaign. Money may be spent over 10 years, or over one year. The spending policy may only commence in four years time, and so on. None of the spending figures for future years are ever discounted and converted back into present value amounts. For many government programs the amounts of money announced are often inadequate to fund the stated goals of the project, and so can only be regarded as a very rough estimate of the spending that will actually occur. In other words, both the magnitude and timing of spending are not always transparent.
Irrespective of these difficulties, we wish to make two important distinctions. First, tax cuts are not equivalent to spending. Spending occurs when the government raises revenue -- usually by taxation -- and then spends the money. Spending in this context involves the government purchasing an asset, paying wages and salaries to its employees, or giving the money to recipients of benefits. Tax cuts, on the other hand, involve the government never raising the money in the first place.
To argue that a tax cut is the same as spending we should consider the following simple example: The school-yard bully takes your lunch money every day and buys himself a pie at the school tuck-shop. One day, the school-yard bully announces that he will not steal your money anymore. You buy a pie for yourself at the tuckshop. To be sure you now have pie you never before had, but it is not the case that the school-yard bully bought you a pie.
Second, tax deductions, rebates, and other so-called "tax expenditures" are not classed as spending either. In the Federal Budget papers they appear as reductions in revenue, not as increases in spending. Tax expenditure can be thought of as being a targeted tax cut. If you undertake activity X, the government allows you to deduct part of the expenditure from your tax bill. To take our school-yard bully example, imagine the bully takes your lunch money, buys himself a pie and then lets you have a bite of the pie if you let him copy your homework.
To be fair, the school-yard bully example is not entirely appropriate to explain government behaviour. It is true that government does have a monopoly in violence, but the government, unlike the school-yard bully, adds value to the economy by maintaining the rule of law and protecting property rights. Nonetheless, the example does capture the flavour of the differences between spending and tax cuts, and spending and tax expenditures.
These differences are important when analysing what the parties have put on the table. On the revenue side, the Coalition has announced $34 billion in tax cuts over four years (with more to come) and the Labor Party has promised $31 billion in tax cuts over four years (also with more to come), with Labor's education tax rebate making up most of the difference. After that, there is substantial disagreement on the figures.
To gauge the numbers, we examined The Age/SMH election website, The Australian election website, the Sunday Telegraph Spendometer (devised by one of the authors of this report) and the websites of the two major parties. The numbers are all very different (as shown in Table 1).
Table 1: Dollar Value of Election Campaign
Commitments -- as at 19 November 2007
| Coalition Spend | ALP Spend | |
| The Age/SMH "Porkometer"* | $64.605 bn | $53.233 bn |
| The Australian* | $65 bn | $54.7 bn |
| Sunday Telegraph "Spendometer" | $6.22 bn | $7.9 bn |
| Coalition's own calculations | $11.650 bn | $12.3794 bn |
*includes announced tax cuts
Why is there such a large discrepancy in these figures? The first point to note is that The Age/SMH and The Australian numbers are large and very close to one another because their methodology is similar. The Sunday Telegraph and Coalition numbers are much smaller because they do not include the tax cuts or double counting of announcements and the like. In other words, the larger figures take all announcements at face value, even if they are re-announcements of existing money or repackaged money. Everything gets lumped together and added to tax cuts to give an over-inflated impression of what both parties are actually planning to spend.
The second point to note is that the Sunday Telegraph and the Coalition's figures show the Government as having promised to spend less than the ALP -- this is in contrast to the two major newspapers and the general public perception. We were unable to get data from the ALP itself on its calculations of its own spending or Coalition spending promises.
In any case, this brings us to our third point: none of these sums of money are very large compared to existing government spending. The discrepancies between the methodologies (and between parties) look big, but in reality they are not. Both parties agree that the large government spending programs -- social security and welfare ($86 billion in 2005-06), health ($37 billion), defence ($15 billion) and education ($15 billion) -- will continue to grow over the next four years.
Despite the media frenzy that accompanies campaign spending announcements, additional spending and tax cuts promised during election campaigns are simply not that economically important, relative to the massive spending programs that will not be touched at all during this campaign and which will continue to grow no matter who is in power.
To place these numbers into context, we examined how much revenue the Federal Government already intends to raise and how much it already intends to spend over the next few years. In 2007/8 alone, the Federal Government plans to spend $235 billion. Over the next four years 2007/8-2010/11 the Federal Government already plans to spend over $1 trillion. The Australian has estimated the Coalition will "spend" an additional $65 billion over that same four year period. In other words, even the most lavishly extravagant, double-counted estimate of the election promises will add only 6.5 percent additional spending over the next four years. That is a miniscule amount compared to the overall size of the Federal Government. Any notion that the differences in campaign spending promises (however they are measured) will have significant implications for inflation or interest rates is patently absurd.
Election spending promises are far less important than the amounts of money that will actually be spent in total during the next government's term of office. The political significance of campaign spending announcements exceeds their economic significance -- and both parties (and the media, we suspect) would like to keep it that way.
WHAT TAX CUTS COULD WE HAVE RECEIVED?
There are several ways one could estimate the tax-cut equivalent of additional campaign spending. We favour a simple, direct approach -- we took the figures that the Federal Government released comparing the Coalition tax cuts and the ALP tax cuts. These calculations were undertaken by Treasury and we have no reason to doubt their accuracy. We then simply grossed the data up by the relative value of the spending. So instead of delivering some tax cuts and some spending over the next few years, we have calculated what would have happened if all the promises had consisted of tax cuts.
Chart 2: What price spending (Coalition)?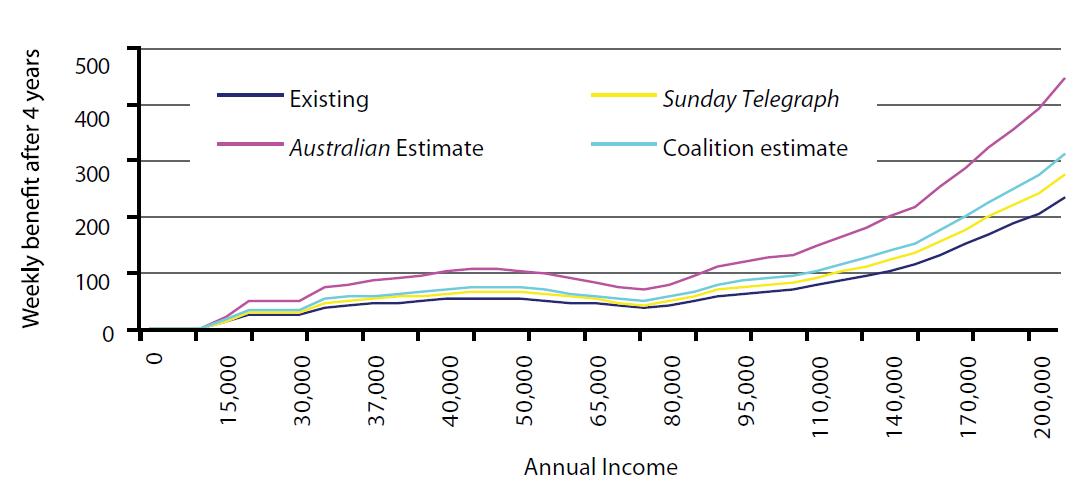
Chart 3: What price spending (ALP)?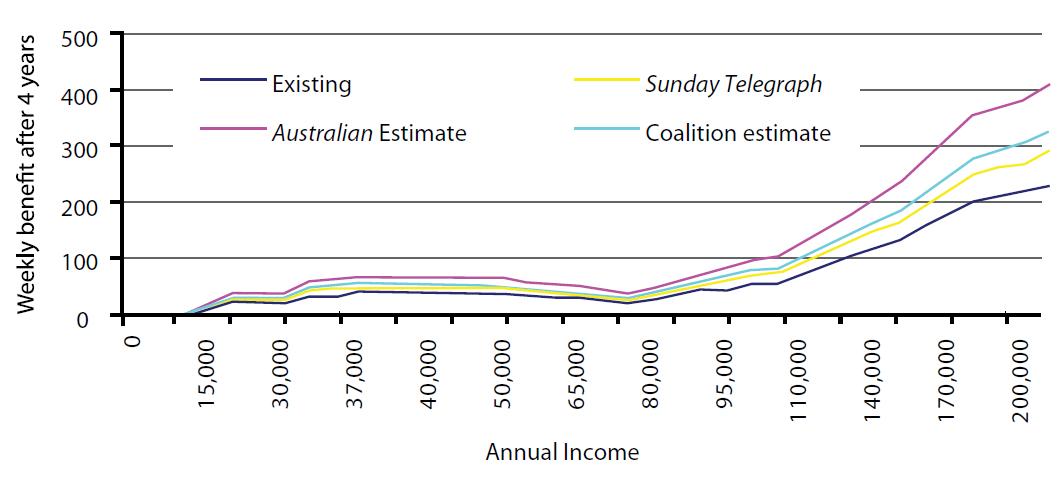
The charts above show the result of this exercise. Depending on which of the estimates are believed, the additional tax cuts that could have been offered (but were not) are either quite large or quite modest. Both the estimates by the Sunday Telegraph and the Coalition are low compared to The Australian and The Age/SMH estimates and are low compared to the proposed tax cuts. We prefer these former estimates to The Australian and The Age/SMH estimates.
According to the Coalition's own calculations of the size of its and Labor's tax cut and spending commitments, the average taxpayer earning approximately $60,000 per annum would receive a benefit after four years of $65 per week under the Coalition's plans and $52 per week under the ALP's plans -- if each party's tax policy was implemented and if the amount each party promised in new spending was instead devoted to tax cuts. If the Sunday Telegraph's calculations were used these figures would be $58 per week under the Coalition's plans and $47 per week under the ALP's plan. Using the estimates of The Age/SMH and The Australian, after four years the average taxpayer would be $94 per week better off under the Coalition, and $66 per week better off under Labor.
It can be said, therefore, that regardless of who's figures are believed the average taxpayer would be better off after four years by at least $58 per week under the Coalition and $47 per week under Labor, if tax cuts were delivered instead of spending increases.
CONCLUSION
This election we have seen both parties announcing tax cuts early in the campaign and then announcing increased spending. Relative to the amount that government already spends, the tax cuts were quite small and the increased spending smaller still. We have calculated the opportunity cost of the increased spending in terms of foregone tax cuts.
Table 2: Australian Government general government sector revenue,
expenses, net capital investment, fiscal balance and net worth(a)
| Revenue | Expenses | Net capital investment | Fiscal balance | Net worth (b) | ||||||
| $m | Per cent of GDP | $m | Per cent of GDP | $m | Per cent of GDP | $m | Per cent of GDP | $m | Per cent of GDP | |
| 1996-97 | 141.688 | 28.0 | 145,809 | 26.7 | 90 | 0.0 | -4,211 | -0.8 | -74,354 | -13.6 |
| 1997-98 | 146.820 | 25.4 | 148,646 | 25.7 | 147 | 0.0 | -1973 | -0.3 | -68,544 | -11.9 |
| 1998-99 | 151.897 | 25.0 | 146,620 | 24.1 | 1,433 | 0.2 | 3844 | 0.6 | -76,150 | -12.5 |
| 1999-00 | 167.158 | 25.9 | 156,492 | 24.3 | -1,225 | -0.2 | 11,892 | 1.8 | -40,552 | -6.3 |
| 2000-01 | 162.074 | 23.5 | 157,667 | 22.9 | -1,168 | -0.2 | 5,575 | 0.8 | -43,299 | -6.3 |
| 2001-02 | 162.956 | 22.1 | 166,758 | 22.7 | -369 | -0.1 | -3,433 | -0.5 | -48,429 | -6.6 |
| 2002-03 | 175.513 | 22.5 | 170,999 | 21.9 | -219 | 0.0 | 4,734 | 0.6 | -53,251 | -6.8 |
| 2003-04 | 187.924 | 22.4 | 182,371 | 21.7 | 724 | 0.1 | 4,830 | 0.6 | -39,595 | -4.7 |
| 2004-05 | 206.605 | 23.0 | 195,680 | 21.8 | 147 | 0.0 | 10,778 | 1.2 | -30,279 | -3.4 |
| 2005-06 | 221.918 | 23.0 | 206,096 | 21.3 | 1,052 | 0.1 | 14,770 | 1.5 | -22,835 | -2.4 |
| 2006-07(e) | 235.539 | 22.8 | 221,625 | 21.5 | 2,025 | 0.2 | 11,888 | 1.2 | -10,852 | -1.1 |
| 2007-08(e) | 246.761 | 22.5 | 235,590 | 21.5 | 1,171 | 0.1 | 9,999 | 0.9 | -587 | -0.1 |
| 2008-09(p) | 260.726 | 22.8 | 247,489 | 21.6 | 1,377 | 0.1 | 11,860 | 1.0 | 14,064 | 1.2 |
| 2009-10(p) | 274.614 | 23.1 | 259,652 | 21.8 | 861 | 0.1 | 14,101 | 1.2 | 29,122 | 2.4 |
| 2010-11(p) | 287.312 | 22.9 | 272,669 | 21.8 | 939 | 0.1 | 13,704 | 1.1 | 44,137 | 3.5 |
(a) The fiscal balance is equal to revenue less expenses less net capital investment. Net worth is calculated as assets less liabilities.
(b) There is a break in the net worth series between 1998-99 and 1999-00. Data up to 1998-99 are sourced from the Australian Government's Consolidated Financial Statements based on Australian accounting standards. Data beginning in 1999-00 are based on the GFS framework. For the general government sector, the major change across the break in the series is an improvement in net worth. This is primarily due to the move from valuing investments in public corporations at historic cost to current market value (which is caluclated using the share price for listed corporations). This is partly offset by defence weapons platforms no longer being recorded as assets and valuing debt at current market value.
(e) Estimates.
(p) Projections.
Source: Budget papers
No comments:
Post a Comment