A submission to the Victorian Government's issues paper
"Driving Investment in Renewable Energy in Victoria"
SUMMARY
- The Victorian Government is proposing a major expansion in wind power. It intends to boost renewable energy to 10 per cent of the total electricity supply by 2010. This is double the likely share of renewable energy under present trends at current subsidy levels.
- The cost impositions of this additional generation are estimated to be $78 per MWh compared with $34 per MWh for commercially produced electricity. Cost premia also include the intrinsically higher cost of wind derived electricity and the expenses associated with back-up plant that the poor reliability of wind energy makes necessary.
- The Victorian Government proposal would require a tax on existing commercial energy supplies or new subsidies to selected projects. The tax equivalent of the new subsidies necessary to make additional renewable energy viable amounts to a new impost on the Victorian consumer of between $108 and $135 million per annum. Because this proposal would require assurances of subsidies for at least 15 years, it involves a "wealth tax" on Victorians of between $981 and $1,230 million. Additional second round cost imposts will also be incurred because of electricity's essentiality within the modern economy and the particular importance of low cost energy to Victoria's industrial and commercial structure.
- It has been argued that such measures will also create jobs. However, protectionist policies involving job subsidies have proven to be unsuccessful in Australia and elsewhere. This is because the increased costs result in job losses that more than offset any that are created. Moreover, the subsidy equivalent per job of wind generation makes this proposal especially undesirable. The subsidy for wind generation is estimated at between $600,000 and $1,000,000 per job.
- Policies regarding greenhouse gas emissions are the responsibility of the Commonwealth Government. State Governments do not have the appropriate national perspective or the expertise to undertake such activities. To the extent they seek to implement separate policies, they are likely to encourage a job migration to jurisdictions that avoid incurring the costs.
THE VICTORIAN GOVERNMENT'S PROPOSALS
FORERUNNERS OF THE ISSUES PAPER
The national scheme for promoting renewable energy, the Mandatory Renewable Energy Target (MRET) requires that 9,500 GWh of designated new renewable energy be used in Australia by 2010.
Australian electricity consumption in 2004 was some 200,000 GWh and at a forecast growth rate of 2.33% per annum is expected to be a little over 230,000 GWh by 2010, the date when the MRET scheme reaches its mature requirement of 9,500 GWh. This puts the required uptake at 4.1%. When Prime Minister John Howard announced the proposal to introduce an MRET scheme in 1997 he said it was for an additional 2% of electricity that was to come from "renewable or specified waste energy". Lobbyists wasted no time in seeking to put an expansive spin on his statement and by the time it passed into law it had been translated into 9,500 GWh by 2010. This is far more than "an additional 2%", indeed it is double a full 2%. (1)
A review of the scheme in 2004 (the Tambling Review) recommended it be increased to 20,000 GWh by 2020. In June 2004 the Commonwealth announced that it did not believe expanding the target was economically justified and that it did not intend to increase the requirement.
The NSW Government introduced its NSW Greenhouse Gas Abatement Certificates (NGAC) scheme in 2003 which set a benchmark for emission standards of 7.27 tonnes of CO2 per head. (2) On top of the Commonwealth MRET scheme, based on business-as-usual estimates of market growth and carbon intensity of electricity generation, an additional 19% of electricity in NSW must be derived from low carbon emitting sources. Appendix 1 outlines the calculation of this estimate.
Queensland has its 13 per cent GEC scheme under which 13 per cent of the non-exempt load must be derived from gas based electricity generation. The exempt load is 9,000 GWh hence, after also deducting for loss factors in transmission and distribution, the requirement covered 75 per cent of the 2005 load.
The Victorian Government has issued many statements and commissioned several major studies into greenhouse matters and alternative energy. Recent studies issued include an Action Plan issued in April 2005 by the Environment Minister John Thwaites. (3)
This stated that:
The world is warming faster than at any time in the last 10,000 years. The 1990s was the warmest decade in the past millennium. Climate change will have an increasingly significant impact on Victoria's environment, communities and business.
The report also suggested that, "by 2070 Victoria's mean temperature could increase by up to 5°C". And it argued that eventually emission levels will need to be reduced by 75 per cent from those presently prevailing and that Victoria should start to move along the path of a low carbon economy. The report also indicated that there were considerable business benefits from such a process, citing claims that global emission trading markets were likely to reach US$40 billion in 2010.
A Press release by the Victorian Premier (2 November 2005) appeared to have increased the pressure the government was placing on itself to undertake policies that involve costs to consumers and to industry in the state.
In that press release the Premier argued that there was a, "lack of national leadership" by the Federal Government in not increasing the MRET scheme from the 9500 GWh target set for 2010 and said this, "is costing Victoria -- economically and environmentally -- and cannot be allowed to continue."
The Premier announced that,
Victoria is looking at introducing its own scheme to increase the uptake of wind and other renewable energy sources to run in parallel with the MRET scheme.
We want to look at what marketbased measures will help us reach our aim of more than doubling the proportion of renewable energy used by Victorians to 10 per cent by 2010.
Victoria's aim to facilitate the development of up to 1000 megawatts of wind energy by 2006 represents $2 billion worth of capital investment. Then there are the jobs and the other economic spinoffs that accompany such a significant outlay.
Victoria already has a number of measures to support renewable energy and reduce energy usage. These include:
- $41 million for innovations and commercial deployment of renewable and low greenhouse intensive technologies and geothermal energy.
- Support for Green Power including a commitment to purchase 10 per cent of its own power from such sources.
- The 5 Star Standard for new residential housing requiring a mandatory solar heating or water tank option.
- Facilitation of wind power installation through requiring subsidised grid connection.
INTERNATIONAL DEVELOPMENTS
In many respects early 2005 represented the apogee of the Kyoto process. The Protocol had finally come into effect with the accession of the Russian Federation and preparations were well advanced for the Montreal Convention which was further to progress the obligations made at Kyoto in 1997.
As the year progressed the confidence ebbed in Kyoto as the basis for measures to control climate change (or at least, emissions that are said to cause it).
In July, the US refused to move closer to the Europeans and announced its continued opposition to international controls, a position in which the other G8 leaders acquiesced.
In September one of the strongest proponents of Kyoto, Tony Blair said,
"I would say probably I'm changing my thinking about this in the past two or three years. I think if we are going to get action we have got to start from the brutal honesty about the politics of how we deal with it. The truth is, no country is going to cut its growth or consumption substantially in the light of a longterm environmental problem. (4)
Neither of the 21st Century's two nascent economic giants, China and India will agree to any major emission restraints, a position that in general is also followed by other developing countries. Moreover, it was becoming increasingly apparent that only two or three of the two dozen signatories to Kyoto that agreed to targets that were to restrain their emissions would actually meet their obligations.
It therefore came as little surprise that the Montreal meeting in December 2005 failed to agree to more intensive commitments on emission controls. However, continued measures to restrain emissions and research low emission technologies continue to be announced including at that meeting and others, like the Asia-Pacific Partnership for Clean Development and Climate (comprising Australia, China, India, Japan, South Korea, and the US) which met in Sydney in January 2006.
THE ISSUES PAPER: DRIVING INVESTMENT IN RENEWABLE ENERGY IN VICTORIA
The DOI's Issues Paper traverses the developments in policy and outcome with renewable energy. It acknowledges that voluntary action on the part of consumers through the Green Power scheme which allows consumers to opt for -- more expensive -- green power for all or part of their individual load has not been successful enough to stimulate significant renewable energy developments.
The Issues Paper takes as a given the decision to introduce a scheme under which 10 per cent of the state's energy load will be supplied by renewable sources by 2010 and teases out various practical issues. These include timing; the form of the requirement (per cent of energy or specific quantities) and its transition; whether there should be technology neutrality; how to ensure that investors have sufficient incentive to commit to long lived projects; how to ensure that the existing recipients of subsidies do not get a double benefit; banking and borrowing; and administrative arrangements.
The Issues Paper also notes that Victorian production has achieved less than half the State's liability under the MRET scheme. Confusion over the meaning of this should be avoided. The scheme applies on a national scale and it would be inappropriate (and probably unconstitutional) for any jurisdiction to attempt to specify that its share be filled by production from within its own borders.
ESTABLISHING THE COSTS OF THE GOVERNMENT'S PROPOSAL
COST OF INCREASING LEVELS OF RENEWABLE ENERGY
Wind would have only the most trivial of market shares if it were not subsidised or favoured in some way by regulated requirements on the part of energy users.
The Victorian Government is examining its proposal to set a target of 10% renewable energy for the Victorian Scheme. This is intended to be in place by 2010 and be over and above existing levels and the Commonwealth's MRET scheme. Regarding the latter, by 2010 this is expected to be 4.1% (9500 GWh from a projected market of 230.8 GWh). Much of the Commonwealth's regulation will be filled by wind power which is the lowest cost source of renewable power available now that the incremental supplies of other, lower cost, renewables are basically exhausted.
The costs of wind power are often quoted at $75-80 per MWh. This however is the cost on the basis that other sources of power will fill the gap created by the inherently episodic and hence unreliable nature of wind. Clearly, once wind becomes relatively substantial as a source of power, other investments will be required to be available to bring about a level of reliability equivalent to that of which would prevail in the absence of this source of power.
Wind power has a level of firm reliability variously estimated at between 4% and 10% of its capacity. This means that additional back-up is required from other energy sources if aggregate grid reliability is not to be impaired. The best way of quantifying this is to model the increased wind with additional idle back-up capacity. Such capacity, say in the form of fast start gas plant, is estimated to cost some $10 per MWh. Alternatives, like requiring higher levels of under-committed capacity from existing (mainly coal fired) plants would be considerably more expensive (at least $25 per MWh) while building additional transmission lines to allow greater imports would also be more expensive (and might not provide the same degree of reliability).
Hence a reasonable way of modelling the increased cost of renewable energy is to take its market price (~$75-80) plus its additional reliability costs (~$10) less future costs of power. On the d-cypha Australian Electricity Futures Settlement Prices this is $34 for calendar 2009, the latest year for which prices are readily available.
Hence the additional costs are $54 per MWh for 10% of total Victorian demand ($78-$34+$10). Total Victorian load in 2009/10 is estimated by NEMMCo at 50,297 GWh. It should be noted that this is a conservative estimate since it takes no account of the additional costs of transmission which might be considerable since the best locations for wind generation tend to be remote.
THE TAX EQUIVALENT EFFECT OF THE PROPOSALS
The Victorian Government's Issues Paper seeks a 10 per cent share for "a range of renewable energy sources" by 2010. The paper quotes Sustainability Victoria in suggesting there will be a likely shortfall of 2,500 GWh.
We estimate the shortfall will be somewhat less than this.
We forecast that Victoria's load in 2010 will be 50,297 GWh. 10 per cent of that means 5,030 GWh. According to the Issues Paper, the 1995 level of renewables was 962 GWh (p.6). Assuming Victoria's renewable load will be similar to that specified nationally, this means an incremental consumption of designated additional renewables of 4.12 per cent under the Commonwealth's MRET scheme of 2,072 GWh. (5) A shortfall of 1,995 GWh is therefore implied from the Issues Paper's 10 per cent target (5,030-962-2,072).
These estimates are illustrated in Figure 1.
Figure 1: Our and Victorian Government Estimates of energy shortfall
| Sustainability Victoria | Ours | |
| Total electricity output 2010 GWh | 50,3000 | 50,3000 |
| MRET load GWh | 1,568 (inferred) | 2,072 |
| Pre-MRET renewable load (GWh) | 962 | 962 |
| Shortfall on the 10% target (GWh) | 2,500 | 1,995 |
The regulatory tax cost can be estimated by applying the $54 cost premium of renewable wind generation (assuming that other lower cost supplies are fully exhausted by existing developments undertaken on fully commercial terms and by those subsidised by the MRET scheme). On the basis of the Issues Paper's estimated shortfall this is $135 million per annum and on the basis of our own estimates of the take-up of the MRET scheme it is $108 million per annum.
The costs of the scheme will be incurred by consumers. Although in the first instance only about a quarter of electricity is directed to households, this does not mean that the costs to individuals is only one quarter of the $108-$135 million per year mooted regulatory tax. Businesses must pass on any additional imposts to their own customers -- there is no "magic pudding" whereby costs not imposed directly on the final consumer are avoided. If this were so, governments would simply levy all taxes on businesses. The final cost is reflected in costs to individuals through:
- Direct increases in charges
- Indirect increases in charges as intermediary suppliers pass on their own costs
- Reduced activity (fewer jobs/lower wages) as businesses shift in response to the lowered competitiveness that the regulatory tax entails.
Were the costs to be reflected only in the price that consumers paid for electricity, the 2010 outcome would be an annual price hike per customer connection of $50 (on the basis of our estimates) or $62 (based on the estimated shortfall inferred from the Departmental Issues Paper). This assumes no impost on business -- a realistic assumption in the longer term since business costs will be passed on to consumers.
Details of how these estimates were derived are provided in Figure 2.
Figure 2: Victorian Costs of a 10 per cent Renewable Goal
| 2004 | 2005 | 2006 | 2007 | 2008 | |
| Total load (GWh) | 45,148 | 45,820 | 46,660 | 47,506 | 50,297 |
| Shortfall GWh (based on pre-MRET of 962 GWh, MRET being 4.1%) | 1,995 | ||||
| Shortfall GHh (Vic. Govt. estimate) | 2,500 | ||||
| Cost of shortfall ($/MWh) | $54 | ||||
| Additional cost (business as usual: 4.1%) | $107,755,034 | ||||
| Additional cost (Vic. Govt. estimates) | $135,000,000 | ||||
| Additional cost/consumer (business as usual: 4.1%) | $26,876,841 | ||||
| Additional cost/consumer (Vic. Govt. estimates) | $33,672,427 |
These sums are required year by year. As wind power will require some 15 year assurances of the necessary support, the net present value of requiring 10% renewable energy is between $1-$1.2 billion. (Figure 3)
Figure 3: Our and Victorian Government estimates
| Net present value at 7% discount rate for 15 years | |
| Our estimated shortfall | $981,423,587 |
| Vic. Govt. estimated shortfall | $1,229,568,391 |
These are "first round" effects of the regulatory impost.
The costs create additional feedback effects that typically range between an additional 20 per cent to 100 per cent of these effects. Victoria is particularly vulnerable to a major dislocation as a result of the important role cheap power plays in its industrial structure. At some point, for example, increasing regulatory tax imposts will cause the aluminium smelting facilities at Portland and Point Henry to become uneconomic and the company will pull out. Long before that, the intensive energy using facilities will have decided to exclude Victoria from consideration for future investments.
ACCESS Economics have prepared some indications of the effect based on their General Equilibrium Model. The ACCESS model, like many other such models, assumes that the costs of the policy are gradually absorbed within the economy and become negligible. According to the modelling, if the regulation were introduced in 2010:
- the real Gross State Product in that year would be reduced by $104 million;
- the initial effect would be a net reduction in jobs equivalent to 2,500 full time employees;
- major negative effects would be found in coal mining, metal production and electricity production.
THE TAPESTRY OF RENEWABLE ENERGY RESOURCES
Although the MRET scheme and measures to promote exotic renewable power sources have focussed heavily on wind power, this has failed to achieve the dominant position expected of it. Figure 4 shows the creation of RECs by power source since 2001.
Figure 4: New RECs since 2004
| Hydro | 36% |
| Solar water heater | 20% |
| Bagasse cogeneration | 10% |
| Wind | 18% |
| Landfill / sewerage gas | 9% |
| Other | 6% |
The availability of RECS has led to innovative measures by potentially eligible fuel sources. Hydro generators in particular have been able to operate in such a way that they create RECs in alternate years. Wind is however increasing its share -- compared to the five year average of 18 per cent it has approached 30 per cent of new RECs in the past two years.
INTRODUCING WIND ENERGY INTO AUSTRALIA'S ENERGY MIX
Production of wind energy in Australia is currently on a small scale (601MW) however there are a number of proposals in planning stages and some state government initiatives that could see the widespread proliferation of wind energy facilities (WEFs) in Australia.
The underlying motivation for installation of WEFs comes from a variety of sources:
Environmental:
- Production of emission free energy.
Political:
- Creating visible symbols of environmental position to capture "green" voters. Delivering investment outcomes such as jobs and returns to investors.
Industrial:
- Creating new markets for established overseas manufacturers.
Financial:
- Delivery of guaranteed cash flows on infrastructure investment.
- Potential to drive up profitability of peaking plant operators who provide gas fired or hydro backup to wind generators.
- Potential for energy retailers to sell higher margin product.
Branding:
- Offering an environmental product for sustainable imaging.
OVERSEAS WIND ENERGY MARKETS
Given the low installed capacity in Australia it is worth looking to overseas experience for some of the impacts of WEFs on generation and the economic impacts.
Denmark, Germany and Spain have invested heavily in WEFs with the USA (primarily California) making up the four largest producers.
Denmark, with nearly 20% of total energy production coming from wind, is considered the leader in the field, followed by Germany with 16,400MW (Dec 2004) and Spain with 9,926MW (Jan 2006) installed facilities.
The three European countries each enjoy grid connection benefits and backup supplies that are not readily available within an Australian context.
Evidence from large scale installation of WEFs in Europe has highlighted the deficiencies in wind energy in producing reliable and affordable energy and appears to have had little impact in addressing Kyoto emissions reduction targets in these countries.
The unpredictability of wind energy output is catered within Denmark via the Norway, Sweden (Nordex) exchange and Germany that provides significant backup capacity. This is demonstrated via the transmission system operator (TSO), Eltra, on their website www.eltra.dk online production data. Germany has a very robust grid compared to the "spider web" grid of Australia where generators are located significant distances from load centres. Spain also has a major inter-connector support with France.
Denmark has 2,400MW of installed wind capacity. In a candid assessment of costs Eltra make the following comment (6) "Today's fact is that Denmark has moved from being one of the countries with the lowest costs for electricity generation to one of the most expensive in Europe".
The lack of reliability in wind as an energy source is clearly demonstrated by Figure 5, taken at random from the Eltra website. Effectively it shows that WEFs are producing at 4% of their installed capacity with the balance being provided by Combined Heat and Power generators.
Figure 5: Eltra, 29 January, 2006. 03:47
| Estimated wind turbine production in Western Denmark (MW) | 99 |
| Primary CHP production (MW) | 1731 |
| Estimated local CHP production (MW) | 835 |
| Estimated consumption in Western Denmark (MW) | 1791 |
Figure 6 illustrates the effective collapse of Denmark's entire wind generation capacity early in 2005 when wind speeds caused the automatic shutdown of virtually every turbine in the country.
Figure 6: Challenges to Eltra’s control room on Saturday the 8th January 2005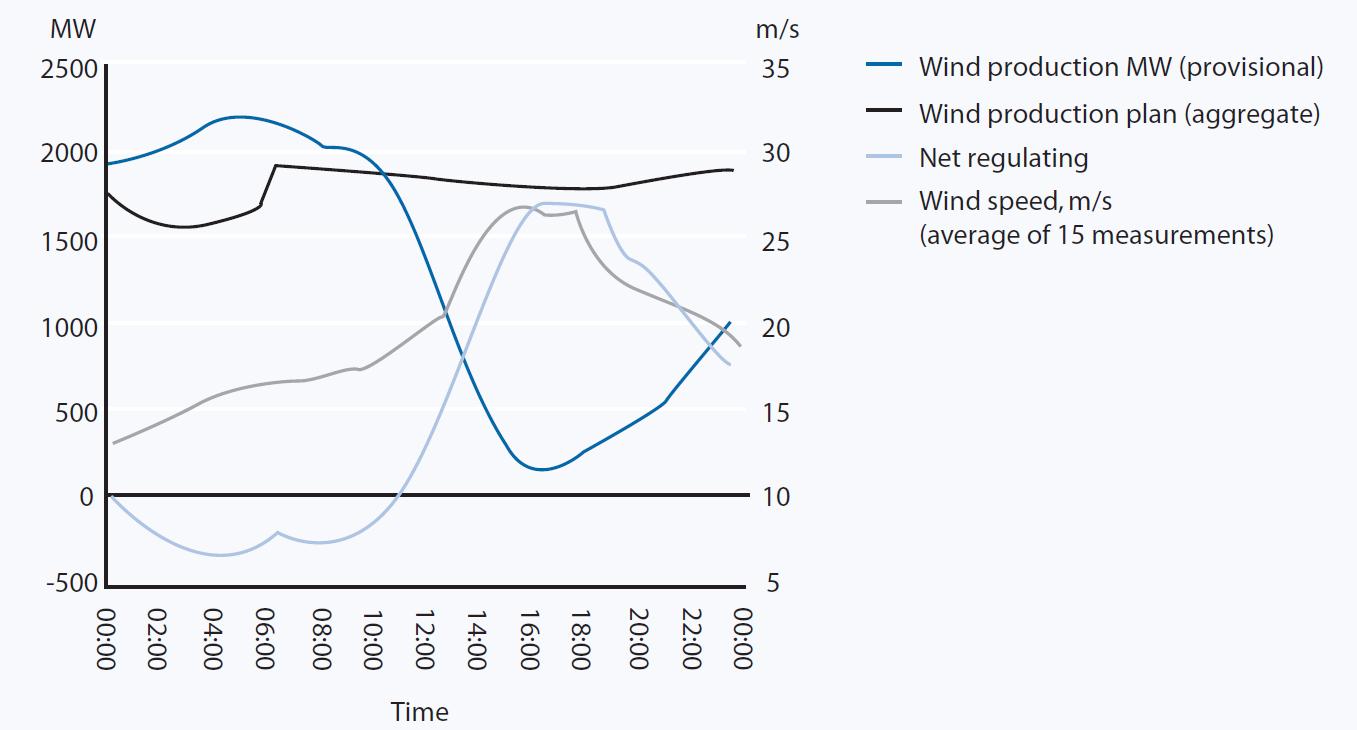
The Spanish TSO Red Electrica provides similar real time data on the production of wind energy from their site www.ree.es. Figure 7 illustrates the variability of production from 9,926MW of installed capacity. Spanish power demand is in the region of 37,000MW. The minimum generation point from wind shown below contributed to around 2.4% of total system demand at the time.
Figure 7: Wind power generation, TSO Red Electrica, 28 January, 2006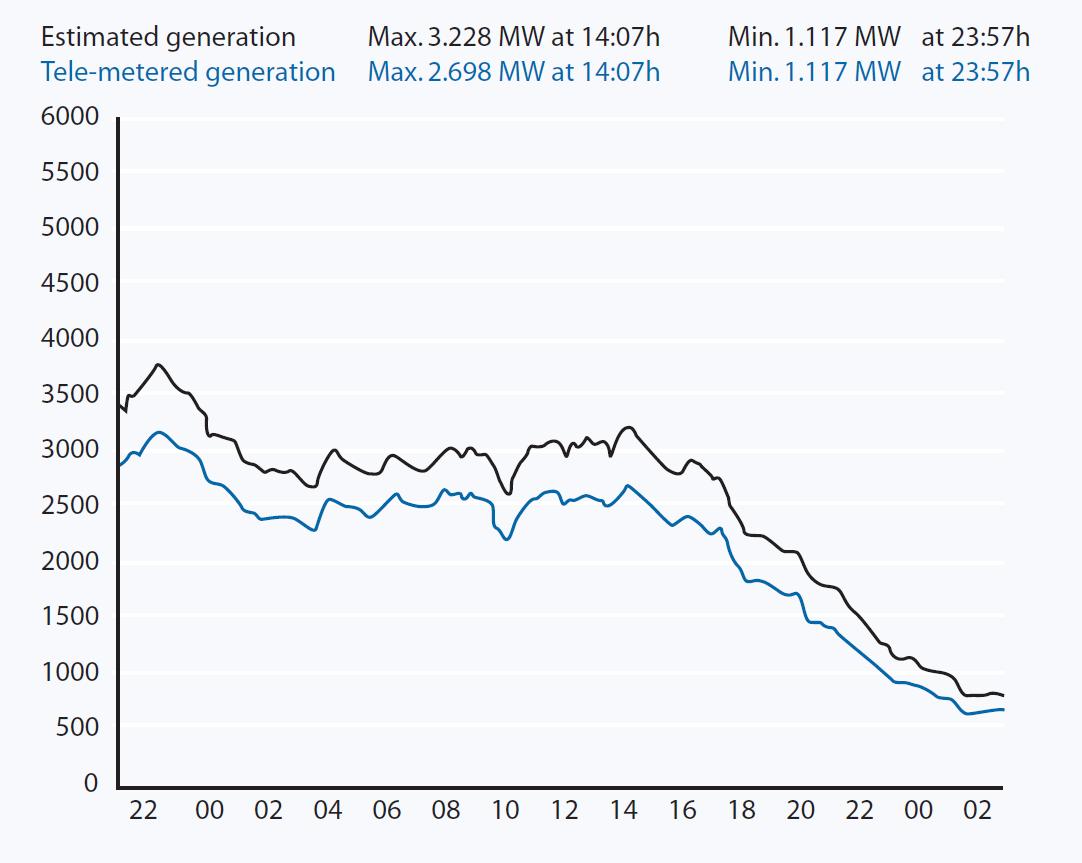
Estimated Generation (black line): total wind power.
Tele-metered Generation (blue line): instantaneous value of wind power generation corresponding to the wind farms which are monitored by Red Eléctrica.
Red Electrica makes the following commentary:
The production of power from wind resources presents some unusual features which are mainly associated with its uncontrollable nature. This factor makes it necessary to have a backup power system of sufficient capacity constantly available. Such backup power must be provided by other sources of energy.
The German TSO Eon.Netz, representing transmission of over 7,000MW of wind capacity in their transmission area, publish a detailed annual assessment of issues in their Wind Report (see: www.eon-netz.com ).
The following extracts are considered pertinent to any assessment of wind energy that chooses to draw on European experience.
Costs:
In total, German wind farms generated 26 billion kWh of electricity, which is around 4.7% of Germany's gross demand. Wind farm operators were paid a total of €2.35 billion, (A$3.77 b) at an average of €ct 9/kWh. (A$14.4c/kWh) Wind power accounted for approximately two thirds of the total 39 billion kWh of renewable power generated by the EEG.
Contribution to guaranteed capacity.
In 2004 two major German studies investigated the size of contribution that wind farms make towards guaranteed capacity. Both studies separately came to virtually identical conclusions that wind energy currently contributes to the secure production capacity of the system, by providing 8% of its installed capacity.
Capacity of widespread installation to contribute to guaranteed capacity.
As wind power capacity rises, the lower availability of the wind farms determines the reliability of the system as a whole to an ever increasing extent. Consequently the greater reliability of traditional power stations becomes increasingly eclipsed. As a result, the relative contribution of wind power to the guaranteed capacity of our supply system up to the year 2020 will fall continuously to around 4%.
Capacity of wind installations to replace traditional generators.
"In concrete terms, this means that in 2020, with a forecast wind power capacity of over 48,000MW (Source: Dena grid study), 2,000MW of traditional power production can be replaced by these wind farms".
Capacity of wind installations to provide power at peak demand periods.
Both cold wintry periods and periods of summer heat are attributable to stable high-pressure weather systems. Low wind levels are meteorologically symptomatic of such high pressure weather systems. This means that in these periods, the contribution made by wind energy to meeting electricity consumption demand is correspondingly low.
According to Laughton (8), Emeritus Professor of Engineering at Imperial College, wind capacity reliability is worth the square route of its nominal capacity but this diminishes with the extent of wind's share in the system. He argues that at very low shares of output, wind reliability is not a significant factor but that with increasing shares of the total load, increasing amounts of the wind must be covered by conventional back up if reliability is to be maintained.
He observes that the market driven level of spare capacity applying under the privatized UK system is 19-20 per cent of the likely maximum load (a similar level to that in Australia). However an escalating level of spare capacity is required with the share of wind in the system. Nonetheless, his estimates of the value of wind as firm capacity are higher than those of some other sources. Thus where wind constitutes 10 per cent of supply, back up of 67 per cent of the wind capacity is required; where wind comprises 20 per cent of supply, back up of 75 per cent is required.
Laughton concludes:
irrespective of the amount of wind capacity installed in the system, the conventional capacity required will never be less than the peak load. Indeed the 20% conventional plant margin needed without wind will never be reduced regardless of the added wind capacity to less than 9 or 10%.
Much otherwise uneconomic conventional plant will need to be retained or replaced either running on low or minimum output or be replaced by plant capable of frequent rapid start and ramping characteristics such as (aeroderivative) OCGT generators.
AUSTRALIAN SCENARIOS
NEMMCO REQUIREMENTS
Electricity must be consumed the instant it is created. Supply must readily follow demand fluctuations and electricity must be delivered within a narrow range off 50 megahertz.
Furthermore, generators are required to meet NEMMCO standards of being able to ride-through grid interruptions and reconnect to the grid within 165 milliseconds. There is considerable doubt that current wind turbine technology can meet these standards without installation of large scale capacitors. There is reluctance within the industry to bear the additional cost of remedying these issues.
WIND AS A CONTRIBUTOR TO GREENHOUSE GAS REDUCTIONS
The Victorian Government official figures on greenhouse gas displacement by wind energy are 1.3 tonnes per MWh. This figure is based on the long run average emissions profile of current Victorian generators and makes the simplistic assumption that whilst the wind is blowing, and WEFs are producing electricity, there is a simultaneous/instantaneous reduction in fuel use by brown coal generators.
This assumption ignores basic facts of generator response times and fuel mix. Given most scheduled (base-load) generators provide energy that is ordered some significant time in advance it is realistic to assume that wind generators will only effectively compete with generators "at the margin", ie: generally fast-start generators, such as hydro or gas fired that can be called upon to meet unexpected or unscheduled demand.
It is thus somewhat ironical that the two most greenhouse friendly types of generator are those that stand to be affected most by the integration of wind. Whilst there is some benefit in storing hydro water for later use, wind energy has the potential to significantly impact profitability of future gas-fired power generators. Peak period plant requires a power price significantly in excess of the current Victorian average of $30/MWh to be viable. In the event of a coincidence of sufficient wind during a high demand period the unscheduled wind generators will displace gas-fired peaking generators as they receive priority into the grid under NEMMCO rules.
The Victorian Government target of 1,000MW of installed wind energy capacity by 2006 would have the capacity to impact significantly on generator profitability. This impact could be offset to some degree by the need to have fast-start generators to follow fluctuating wind energy output. The Codrington wind facility's figures indicate that output can fluctuate by as much as 50% within a 30 second period.
South Australian studies (9) indicate that "wind generation reduces national CO2 emissions in the order of 0.52Mt per MW installed on a Short Run Marginal Cost (SRMC) basis to 0.49Mt per MW installed on a Long Run Marginal Cost (LRMC) basis." This figure suggests that the Victorian estimate is overstated by some 150%.
EMPLOYMENT BENEFITS OF WIND POWER INSTALLATIONS
The capital investment in wind energy would be significant. Current costs are estimated at $1.6m per MW installed. On the basis of the Government's target of 1000 MW of capacity by 2006, this translates into $1.6 billion.
Job opportunities from wind are a prime motivator given by some parties in promoting the technology. No major offshore manufacturer has yet made a significant long-term investment in Australian production facilities. Investments made to date have been limited to lesser-skilled operations such as blade and nacelle manufacture and there have been multiple announcements of new facilities being opened in Asian markets. Thus we can comfortably assume that long-term jobs will be limited to maintenance. The 35-turbine Challicum Hills facility employs one full-time person and this can be used as a benchmark for long-term rural employment from turbines.
To achieve their 1,000MW target the Government will need to provide financial support for a further 450 2 MW turbines. Assuming long-term regional employment of 1 person per 20 turbines this could result in 23 jobs. The effective cost of the subsidy per job per annum thus ranges between $599,565 and $999,782.
Short-term jobs are harder to calculate. Pacific Hydro in the construction of the 30-turbine Yambuk facility claims that 60 construction employees were used at the peak, comfortably translating into two per turbine. The 450 further turbines required to meet the 1,000 MW target would suggest 900 short-term (3 months?) jobs will result. Using the lower ongoing annual subsidy figure of $137,970,000 this crudely translates into $153,300 p.a. per job or a startling $613,200 subsidy per job if one assumes a 3-month employment period.
Whatever the estimates of new jobs that are apparently created by subsidies, it is no longer seriously maintained in policy or economists' circles that any such jobs will eventuate in net terms. For decades, Australia sought to secure jobs through tariff protection on manufactures only to see rising unemployment and a mounting need of protection. The brutal facts are that a subsidy for one job means a tax on existing jobs. The net outcome is, at best, no effect on employment but a negative effect on competitiveness and overall wage and income levels. For this reason, Australia over the past 30 years has dismantled its industry assistance programs and has immensely benefited from this.
REFERENCES
1. The myth that the target is 2% is deeply ingrained. Mr Albanese, the Opposition Environment spokesman was recently quoted (AFR 18 January) as saying, "Most of the European countries have a 20 per cent target. And that is why Labor supports increasing the mandatory renewable target, which is a pathetic 2 per cent."
2. http://www.greenhousegas.nsw.gov.au/
3. http://www.greenhouse.vic.gov.au/images/VicGreenhouse-ActionPlan.pdf
4. http://www.telegraph.co.uk/news/main.jhtml?xml=/news/2005/09/25/nkyoto25.xml
5. The Issues Paper rightly points out that Victoria has not achieved the proportion of such renewables that would be expected given its energy share but the issue is load rather than production.
6. New Challenges for the Transmission System Operator. A report by Jytte Kaad Jensen and Fritz Luxhøi. Eltra, Denmark from December 2, 2002
7. http://www.ree.es/ingles/i-index_ope.html
8. Michael Laughton, "Backing up the wind boom" Platts Power in Europe, issue 460, 10 October 2005, pp10-12
9. ESIPC South Australian Wind Power Study 2003.
No comments:
Post a Comment