Chapter 6 of International Experience in Restructured Electricity Markets (1)
SUMMARY (2)
In Australia prior to 1994 virtually all electricity was supplied through vertically integrated state monopolies. Adecade later, the integrated monopolies had been disaggregated into different businesses with the competitive aspects of supply (generation and retailing) reconstituted into dozens of independent firms, many of them privately owned and the rest "corporatised" and operating at arms length from their government owners. Monopoly aspects of supply are regulated by agencies independent from the jurisdictional governments.
The key milestones have been as follows:
Sequence of events:
- Industry Commission Report into electricity, 1991.
- Tasman Institute report on Victorian electricity corporatisation and privatisation, 1991.
- National Grid Management Council's National Electricity Market (NEM) Paper Trial, 1993/1994.
- Victorian Electricity Market was commenced on 1994. This comprised six major generation businesses, a transmission business and five distributor/retailers. Distribution regulated by independent body. Market gradually opened to competition in 1995-2001. Some price caps remain on household supply.
- Victorian electricity and gas privatisations 1995-1999.
- Competition Principles Agreement, 1995 (A$4.2 billion of Commonwealth funds were set aside for the period of 2005/2006 to implement electricity reform).
- New South Wales (NSW) Electricity Market, 1996. Competitive arrangements were established that were similar to Victoria's. Market opened to competition in 1996-2002 with some price controls on households remaining.
- Agreement on National Electricity Code, 1996.
- Start of NEM, 1998 with the National Electricity Code Manager and the Australian Competition and Consumer Commission (ACCC) setting rule changes at the national level and ACCC setting transmission prices.
- Queensland Electricity Market, 1998. Market opened to competition in 1998-2004 except for households.
- South Australia privatisation, 2001. Full retail competition phased in 1998-2003.
- Australian Energy Regulator (AER) (price setting) and Australian Energy Market Commission (AEMC) (Rule changes) commenced operation in 2005.
- Western Australia de-aggregation of supply but with the generation left within one business, 2005.
Outcomes of these developments have been reductions in prices, especially for commercial users, which were previously subject to Ramsey-type price gouging. (3) The reformed system has delivered increases in capacity in line with market needs and vast improvements in productivity and reliability across the industry.
Government interventions have, however, not been eliminated and continue to threaten the on-going orderly development of the market. Among these potential market distortions are the ramifications stemming from state governments' ownership of over half of the industry. Although all government businesses are corporatised and operate under company law, government ownership brings corporate inflexibilities and sometimes means political interference in key commercial decisions.
More generally, electricity remains an industry with a high political profile. Federal and state governments see electricity supply and pricing as providing them a somewhat unique legitimacy to control. At the very least, this brings distractions to the industry's entrepreneurship and there is ample risk of more serious consequences to the industry's efficiency.
1. THE MARKET BREAKDOWN AND SUPPLY PROFILE
1.1. THE MARKET PROFILE
Australian electricity demand is about 200,000 GWh/annum, which is transmitted along some 850,000 km of lines of which some 26,000 km is along circuits rated at 220 KV or more. There are some nine million customers with demand being divided almost equally between households and industry. Figure 1 illustrates this.
Fig. 1. Electricity consumption.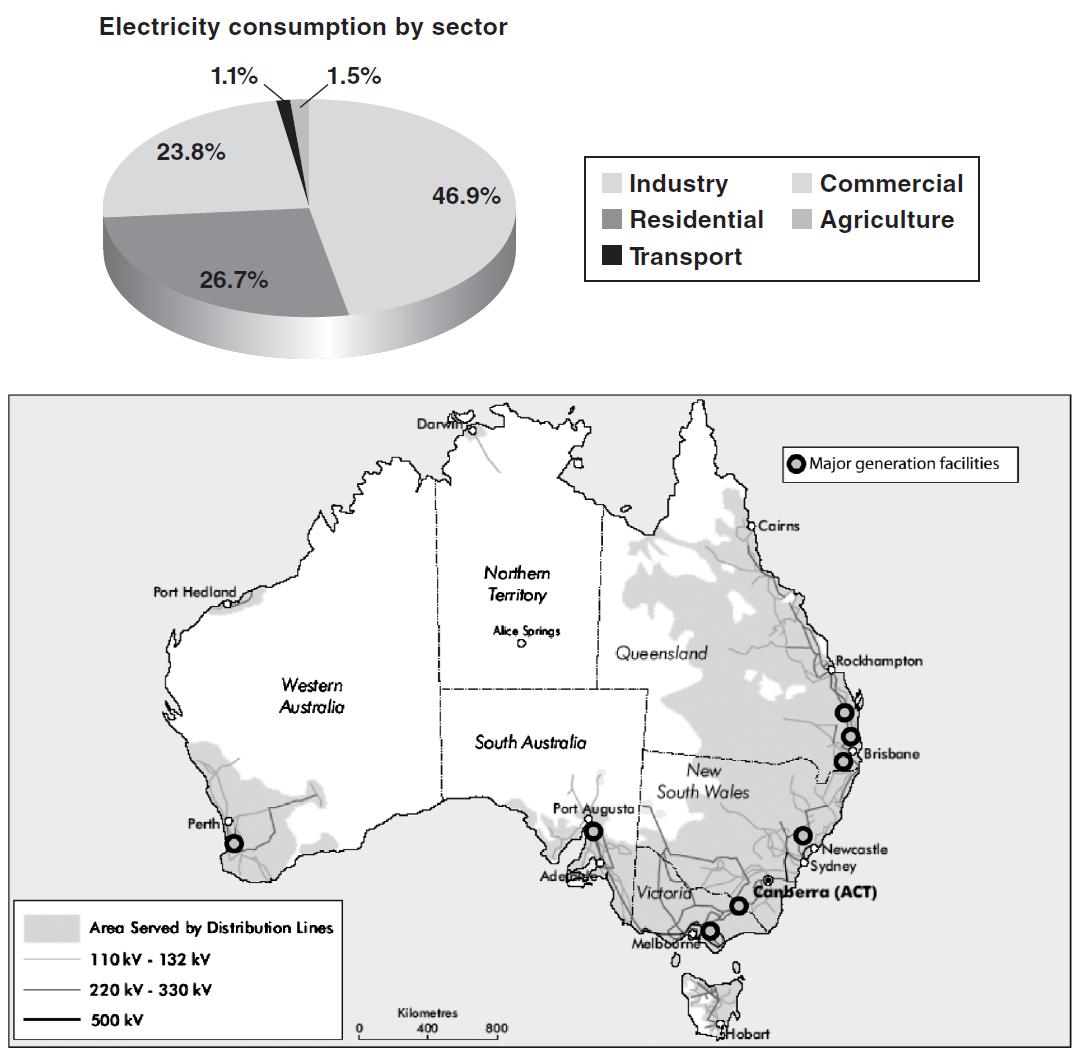 Source: NEMMCO.
The geographic spread of generation facilities and transmission and distribution lines is illustrated below.
1.2. THE FUEL PROFILE OF AUSTRALIAN ELECTRICITY GENERATION
Australia is fundamentally a coal-based electricity system. Coal represents some 85% of electricity supply, roughly one third of which is Victorian and South Australian brown coal.
Hydro capacity is relatively small despite the large land area and is nearly fully developed. Tasmania has further minor potential but green activism will prevent any substantial new development. The share of hydro within total supply has, therefore, been falling to its current level of about 7%.
Gas has shown a modest increase growing from less than 2% of generation 15 years ago to 7-8% at present. Much of this is in the least heavily populated states of South Australia, Western Australia and the Northern Territory where coal is more expensive. Elsewhere gas mainly fills a peaking role due to its lower capital but higher fuel cost.
Figure 2 illustrates the fuel sources of electricity.
Fig. 2.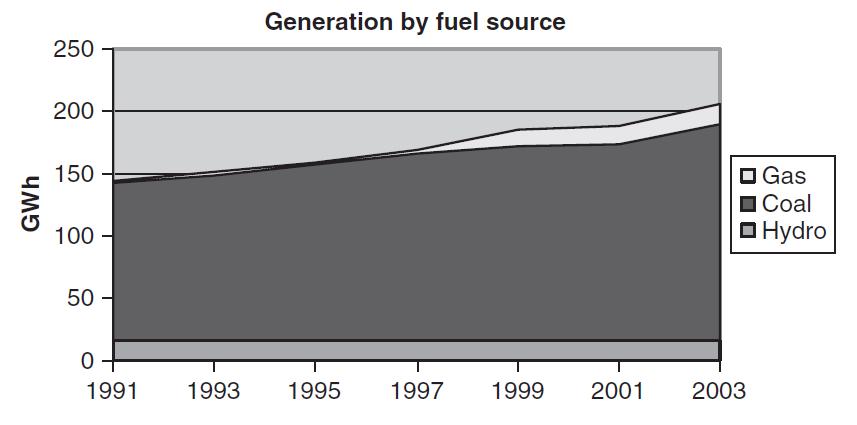 Source: ESAA.
Australia's eight States and Territories vary in size, with New South Wales and Victoria being the most populous and the two Territories, the city-state Australian Capital Territory and the vast Northern Territory each having populations of a few hundred thousand. Most people live along some 4000 km of coastline from Adelaide in South Australia to Cairns in North Queensland. This has resulted in a long, skinny interconnected grid: the NEM. The island of Tasmania is in the process of connecting to the NEM via a 600 MW undersea cable. The only other significant population center, South West Western Australia, has its own grid, which is not economic to connect to the NEM. The same applies for smaller isolated population centers such as the Northern Territory.
Each state has only one pricing node (4) that sets price for all customers and generators within that state. Generally there is little transmission congestion within the states, and a moderate amount between the states - with "interconnectors" constraining ~5% of the time. At these times, the regional prices diverge, sometimes by thousands of dollars per MWh, but very rarely for more than a few hours.
Queensland and Victoria are major net exporters of electricity via the NEM (to South Australia and New South Wales respectively) and New South Wales is also an exporter because it hosts the jointly owned Snowy Mountains Hydro-Electric facility. Tasmania is hydro based and Basslink will allow Tasmania to export its hydro at times of high mainland prices and import baseload low-priced mainland-generated electricity at other times.
Figure 3 illustrates the relative size of the NEM States in terms of energy sent out.
Fig. 3.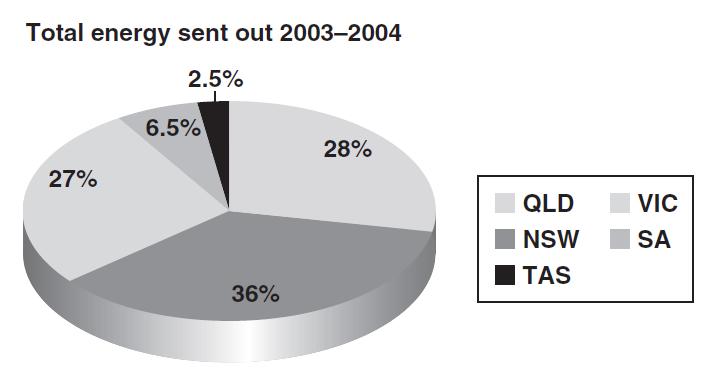 Source: NEMMCO.
2. REFORMING THE STATE OWNED INTEGRATED UTILITIES
2.1. THE PROCESS OF REFORM
The development of a market for electricity got underway in the early 1990s and had three precursors:
- the recognition that other countries were achieving considerably greater efficiencies than Australia in electricity supply; (5), (6)
- National Competition Policy (NCP) involving a general review of the operations of "essential facilities" (which were, in the main, owned by governments) and a requirement that they be opened to non-affiliates on reasonable terms; and
- the consequences of poor financial circumstances in the States of Victoria and South Australia resulting in new governments which sold its energy assets partly in pursuit of a privatisation agenda and in part to reduce debt.
The State of Victoria initiated the reform process. By the early 1990s the then Labor Government had commenced a process of reform particularly focusing on labor shedding in the monopoly supplier, the State Electricity Commission of Victoria (SECV).
A Liberal (Conservative) Government, which won office in 1992, set about a much more aggressive reform and privatisation process. That Government had a strong philosophical belief in the beneficial effects that capital markets could bring to a business as well as being attracted to the idea of transferring risk to private equity. However, the Government was equally determined to get the structure of the market right first. In this, lessons were learned from the outcome of the structural weaknesses in the UK wholesale generation market, where the two dominant suppliers were able to operate so that prices remained high (See Newbery). Great care was therefore taken to establish competition in supply with this being given a higher priority than maximising sale proceeds. 7500 MW of plant was privatised as seven generating companies with transitional prohibitions on re-aggregation.
For downstream supply, five distribution/retail businesses were created and transmission assets were vested in a single business. An independent regulatory framework, the Office of the Regulator General (ORR) later renamed the Essential Services Commission (ESC) was put into place to set prices on the monopoly network assets. This body also gathered performance data that would prove invaluable in defusing claims that privatisation had led to higher prices and lower reliability.
The program for reform was a challenging task. Not only did it involve the need to establish a regulatory framework, in which Australia had no experience, but also because the reform process faced considerable hostility from the unions, the Labor opposition and much of the media. However by the time of the Liberal Government's fall in 1999, the electricity industry had been privatised and assets transferred to seven generation businesses, five distributor/retailers plus a transmission business. There has since been some merger rationalisation as well as some new entry. The sale process earned A$23 billion, far more than the $9-10 billion that was widely expected.
The gas industry's downstream assets were also privatised; gas production was always privately owned.
The fully privatised Victorian electricity and gas industry has three main retailers (CLP Power's TRUenergy, Origin Energy, and AGL), four distribution businesses (CKI-Powercor, Alinta, AGL, and SPI), a single transmission business (SPI) and five major generators (International Power, CLP Power's TRUenergy, Loy Yang Power, Ecogen, and Southern Hydro). There have also been significant new entrants into the competitive generation and retailing businesses.
South Australia, which is only one quarter Victoria's size in terms of customers, privatised its industry (in 1999 and 2000). Its previous government monopoly supplier had been the ETSA Corporation. As in other jurisdictions, ETSA's disaggregation preceded the industry's full privatisation. There is now one distributor, the CKI owned ETSA Utilities and one transmission company, ElectraNet. Only one retailer was created at privatisation, which AGL bought, however there has been significant new entry. Privatised generation is owned by International Power, NRG, and TRUenergy. AGL and Origin built significant new generation capacity early this decade.
In Queensland, the Queensland Electricity Commission (QEC) was a vertically integrated organisation responsible for virtually all electricity supply and was disaggregated in several steps into separate distributor/retailers, a single generation business and an SPI. In 1997 a further progressive disaggregation took place which has resulted in the present industry profile comprising government ownership of two main distributor/retailers (Energex and Ergon), a transmission business (Powerlink) and four generation businesses (Enertrade, CS Energy, Stanwell, and Tarong Energy). There is also private ownership of generation including Intergen and NRG.
The New South Wales Government's prior ownership of the integrated Electricity Commission has undergone several iterations of disaggregation but the separate businesses remain under government ownership. Individual suppliers include four distributor/retailers (Energy Australia, Integral, Country Energy, and Australian Inland) a transmission business (Transgrid) and three coal-based generation businesses (Delta Electricity, Macquarie Generation, and Eraring Energy). There are also two smaller private generators and the Snowy Hydro jointly owned with the Victorian and Commonwealth Governments. The Commonwealth, NSW and victorian governments, which jointly own Snowy, announced in early 2006 that they are to privatise it.
The other jurisdictions have also disaggregated their formerly integrated industry but Tasmania (which will be linked to the mainland grid in 2006) and Western Australia have retained government ownership.
The major ESI businesses and their ownership are shown in Table 1.
Table 1. Major Australian electricity supply businesses.
| Ownership | State of operations | |
| Major generators | ||
| Macquarie | NSW government | NSW |
| Delta | NSW government | NSW |
| Snowy | NSW, Vic federal governments | NSW, Vic |
| Eraring | NSW government | NSW |
| TRUenergy | CLP | Vic, SA |
| CS energy | Qld government | Qld |
| Loy Yang | AGL, Tokyo electric and others | Vic |
| Intergen | International consortium | Qld |
| Tarong | Qld government | Qld |
| NRG flinders | NRG | SA |
| International power | International power | SA, Vic |
| Stanwell | Qld government | Qld |
| Origin | Australian private | Vic, SA, Qld |
| Ecogen | International consortium | Vic |
| NRG Gladstone | NRG, Comalco | Qld |
| Hydro Tasmania | Tas government | Tas |
| Southern hydro | Meridian energy | Vic |
| Enertrade | Qld Government | Qld |
| Major transmission | ||
| SPI | Singapore power | Vic |
| Transgrid | NSW government | NSW |
| Powerlink | Qld government | Qld |
| Electranet | public private consortium | SA |
| Major distribution | ||
| AGL | Australian private | Vic, SA |
| Alinta | Australian private | Vic, WA |
| Aurora | Tas government | Tas |
| Citipower/Powercor/ETSA | CKI | Vic, SA |
| Country | NSW government | NSW |
| Energex | Qld government | Qld |
| Ergon | Qld government | Qld |
| energyAustralia | NSW government | NSW |
| Integral energy | NSW government | NSW |
| SPI | Singapore power | Vic |
| Major retailers | ||
| AGL | Australian private | Vic, SA |
| Aurora | Tas government | Tas |
| energyAustralia | NSW government | NSW |
| Integral energy | NSW government | NSW |
| Country | NSW government | NSW |
| Energex | Qld government | Qld |
| Ergon | Qld government | Qld |
| Origin | Australian private | SA, Vic |
| TRUenergy | CLP | Vic, SA |
Overall Australia's ESI remains mainly under government ownership as illustrated in Figure 4.
Fig. 4.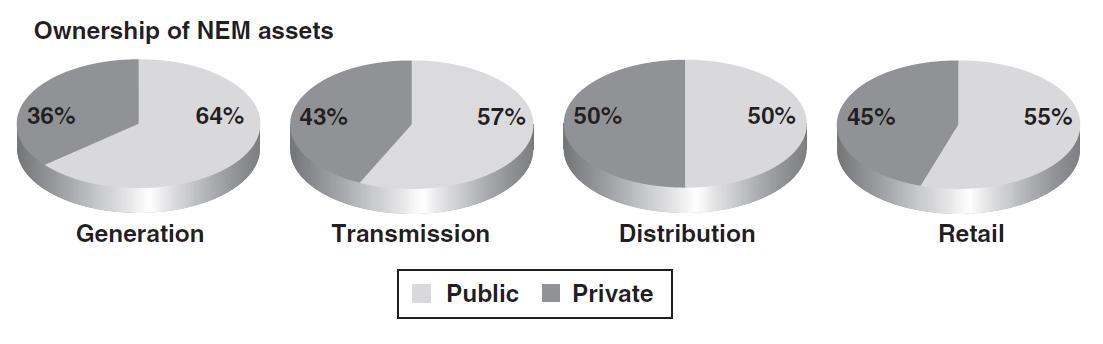 Source: ESAA
2.2. THE NATIONAL SETTING FOR ELECTRICITY MARKET REFORM
The Victorian disaggregation and privatisation took place as a result of financial pressures and pro-competition/privatisation views that were especially prevalent in that state. In the case of other states, the reforms followed on a program of NCP, agreed by the state and Commonwealth Governments in 1996. This was given expression in a new provision of the Trade Practices Act, Part IIIA, an important provision of which required essential facilities to be opened to competition, clear structural separation for the competitive and monopoly parts of integrated businesses and, where practicable, non-natural suppliers were to be divided into rival businesses.
The competition policy reforms called for natural monopolies to be opened to all users on terms that were fair and reasonable. Provisions were made to ensure that regulatory arrangements were put in place to determine where such access was required and, in the event of disputes, the prices at which the access was to be made available. Far and away the most important monopolies over essential services were those of governments themselves - in addition to electricity and gas they included ports, airports, rail, and telecommunications. Indeed, the government owned or controlled businesses were the only ones that in practice had the integration and monopoly characteristics that required the regulatory control. (7)
2.3. MARKET GOVERNANCE
The national market was devised jointly by the state and Commonwealth governments and refined and approved by the national regulator, the ACCC. It originally envisaged two bodies: the National Electricity Code Administrator (NECA) and the National Electricity Market Management Company (NEMMCO) being responsible respectively for the market rules and the market scheduling and planning matters. In the event, the confluence of the electricity market developments and NCP meant that the national regulatory body, the ACCC had to have a role in approving market rule changes because of the inherent monopolistic "collusion" that the NEM entails. The ACCC also was given the role in setting prices for the transmission lines and for gas transmission and the market code for gas.
In addition, state regulators were put in place to set prices for the distribution lines so that in all there were some 12 bodies involved in economic regulation of the industry. Also, there were Ministerial Councils that set agenda issues and generally sought to influence the market. Fortunately, inconsistencies in decisions from such a plethora of regulatory bodies was not as serious as it might have been since there were strong liaison relationships forged through an informal "Energy Regulators' Forum".
Even so, the process of National Electricity Code change was proving somewhat unwieldy with each proposal being examined first by NECA and then by the ACCC. New arrangements were agreed in 2005 that introduce a rationalised control of the industry so that the AEMC is responsible for market rules for both gas and electricity and the AER is responsible for policing the rules and for network price setting at all levels of supply. NEMMCO's functions (as Market/System Operator) remain as those of the ACCC, which also has common staff with the AEMC and AER, with regard to control of mergers and monopolies. It is, of course, uncertain that the changed arrangements will prove more workable especially as there are statutory requirements for these bodies to follow the policies established by the collective state and federal governments.
The AEMC is responsible for rule making and market development. The rule-making role does not involve initiating changes to the Rules other than where the change involves correcting minor errors or where the change is of a non-material nature. Rather, the role involves managing the rule change process, and consulting and deciding on rule changes proposed by others.
In regard to its market development function, the AEMC conducts reviews at the request of the Ministerial Council on Energy or at its own volition on the operation and effectiveness of the Rules or any matter relating to them. In doing this, the AEMC relies on the assistance and cooperation of industry relationships and interested parties in its decision making.
2.4. STRUCTURAL DEVELOPMENTS
At the onset of both the Victorian and the later National Market rules, the provision implementing structural separation of generation, transmission and distribution/retailing contained no specific long-term measures to prevent re-aggregation. This was because there were no firm views as to the most productive structure of the industry, only that the previous state owned integrated monopolies were not optimal.
Although retailing and distribution were sold as combined units, they were to be "ring fenced" to prevent the distribution business favoring its affiliate. The ring fencing has generally proved satisfactory. Not only have incumbent affiliates not been favored but new retailers have entered the market and all five of the original Victorian host distribution business/retailers now have separate companies handling the two activities. (8) This reflects the very different types of business involved. Retailing involves strong marketing and risk management skills in assembling and promoting packages of supply, while distribution is much more concerned with maintaining and reducing costs of an established business. Two of the three major retailers, Origin and TRUenergy, no longer are affiliated with a distributor. Their disaggregation was driven by a search for improved shareholder value whereby different types of business can appeal to different types of investor.
There has also been a trend towards an unexpected form of re-aggregation. This has not been to restore monopolistic supply, which in any event would be combated by general anti-trust laws administered by the ACCC. Instead, all the privatised retailers and many of those remaining in government hands have moved to acquire some generation of their own. Also, Snowy Hydro and several privatised generators have created retail arms. These developments are a function of the need that generators and retailers see to manage risk. Risk management strategies that firms have employed, cover a gamut from different forms of contracting through ownership of supply. Seeking some control over their supply (for retailers) or customers (for generators), is a risk management strategy that follows from the wholesale price shifts to which electricity is now subject.
Early concerns that retailer and generator amalgamations would lead to monopoly power and market inefficiencies have tended to abate as a result of evidence that competition is bringing lower prices and retail churn. The generator-retailer re-aggregation that has occurred has not been anti-competitive. The fact is that electricity retailers like other firms that assemble supplies sourced from affiliated and non-affiliated businesses are forced by market circumstances to ensure that the affiliates are not favored. The risk of high-price occurrences are too great for electricity retailers to gamble on fulfilling most of their needs in-house and the costs of alienating other sources by unprofessional behavior far outweigh any short-term benefits possible through collusion with in-house suppliers.
2.5. RETAIL PRICE CONTROL AND COMPETITIVE CHURN
Retail was a part of the electricity industry envisaged as being contestable and requiring no more regulation than is found in other retail activities. Given its relatively small share of aggregate revenue, retail was also envisaged as being only a minor actor within electricity supply. However, retailing's importance has been re-assessed. In a competitive situation retail, as the interface with the consumer, drives efficiencies by signaling demand shifts and eroding cross-subsidies.
For businesses, full retail competition has been extended to all but the smallest customers and in the four major eastern states probably half the commercial load has shifted from its original retailer.
Governments have been more cautious about deregulating household supply. In NSW, South Australia and Victoria, retail competition at the household level has been accompanied by maximum prices that make it less attractive for retailers to poach customers. Nonetheless there has been a quite considerable churn rate - some 16% in NSW, 42% in South Australia and 44% in Victoria after 3 years of open competition. (9), (10)
In Queensland, Tasmania and Western Australia households are captive to their host retailers which are all owned by the respective state government. In Queensland, household rates are fixed and managed so that Brisbane subsidises the provincial areas. The Brisbane-based supplier is levied a surcharge which is passed to the supplier of provincial areas. The cross-subsidy would be placed under considerable pressure with full retail competition (See Haas in this volume) and the electoral implications of this present the main barrier to the Queensland Government allowing full retail competition. In September 2005, the Queensland Government announced that full retail competition, albeit with a regulated price cap, would be introduced in 2007. Table 2 shows the timetable for retail competition by state and user tranche.
Table 2. Timetable for retail competition.
| Date for eligibility | Site thresholds | Estimated number of customers | Percentage of total energy | |
| New South Wales | October 1996 | ≥40 GWh | 47 | 14 |
| April 1997 | ≥4 GWh | 660 | 29 | |
| July 1997 | ≥750MWh | 3560 | 40 | |
| July 1998 | ≥160MWh | 10,860 | 47 | |
| January 2001 | ≥100MWh | 19,000 | 49 | |
| July 2001 | ≥40MWh | 53,000 | 53 | |
| January 2002 | All sites | 3,000,000 | 100 | |
| Victoria | November 1994 | ≥5MW | 47 | 23 |
| July 1995 | ≥1MW | 380 | 29 | |
| July 1996 | ≥750MWh | 1900 | 41 | |
| July 1998 | ≥160MWh | 6900 | 49 | |
| January 2001 | ≥40MWh | N/A | N/A | |
| January 2002 | All sites | 2,100,000 | 100 | |
| Queensland | March 1998 | ≥40GWh | 80 | 16.0 |
| January 1999 | ≥4GWh | 540 | 15.0 | |
| January 2000 | ≥200MWh | 8110 | 15.0 | |
| 1 July 2004 | ≥100MWh | 7890 | 8.0 | |
| South Australia | December 1998 | ≥4GWh | 160 | 30.0 |
| July 1999 | ≥750MWh | 760 | 40.0 | |
| January 2000 | ≥160MWh | 3360 | 50.0 | |
| January 2003 | All sites | 720,000 | 100.0 | |
| Western Australia | July 1997 | 10MW | N/A | N/A |
| July 1998 | 5MW | N/A | N/A | |
| January 2000 | 1MW | 120 | N/A | |
| July 2001 | 230KW | 450 | N/A | |
| January 2003 | 34KW | 2550 | N/A | |
| January 2005 | 50MW | 10,000 | N/A | |
| Tasmania | July 2006 | 20GWh | 10 | N/A |
| July 2007 | 4GWh | 54 | N/A | |
| July 2008 | 750MWh | 295 | N/A | |
| July 2009 | 150MWh | 1030 | N/A | |
| July 2010 | All customers | 230,000 | N/A |
2.6. OTHER FORMS OF RETAIL REGULATION
On top of price safety nets, the Labor state governments have all imposed their social and green policy objectives via retail regulations for domestic customers. This has resulted in a considerable mish-mash of compliance requirements for retailers selling to small customers and reduced the potential for competition.
From the social policy side we have seen prohibitions on pre-payment meters and latepayment fees supposedly in the interest of protecting the poor.
From the green side we have seen irksome rules like requiring minimum area allocations on retailers' bills for graphs on usage and implied carbon release. More significant are the requirements on retailers to source different percentages of variously defined green power within their aggregate supply. This is addressed in Section 7.
2.7. CONTROL OF TRANSMISSION
Each State has one transmission owner but the planning models are inconsistent. In Queensland, NSW and Tasmania, the transmission owner itself is responsible for planning. In Victoria, a government agency, VENCorp, is responsible for planning the network and SPI owns and operates the assets, whilst South Australia has a hybrid model. SPI in Victoria is unique in that it acquired assets formerly owned by TXU so that it now also owns part of Victoria's distribution network.
A centrally planned provision of transmission was the basic model adopted from the outset. However, it was also recognised that transmission and new generation are alternatives. If transmission is provided free or at regulated prices this may discourage a more rational and lower cost development of new generation. The trade-off between nearby and remote generation (via transmission) is uniquely critical for Australia, where distances between load centers and therefore the cost of transmission are very large, and fossil fuel sources are relatively inexpensive and quite widespread.
This led to provision being made for entrepreneurial interconnects in the National Electricity Law. And Transenergie, a subsidiary of Hydro Quebec, built two of these entrepreneurial links where transmission links were less than robust. Transenergie sought to finance these links by selling generators' access rights to markets and by itself arbitraging price differentials. This merchant transmission gave rise to issues concerning the circumstances under which a regulated augmentation of links should be permitted. Along series of hearings on a regulated link between South Australia and New South Wales resulted in stalemate, with the NSW government transmission business (Transgrid) apparently abandoning its proposal, possibly because NSW is not envisaged to have a generation surplus in future years. (11) In the event, the merchant links in Australia could not compete against the links receiving a regulated return and have applied for and been given regulated status. (12)
The danger is that links which are financed by a compulsory charge on the customer, might lead to incentives to site generation in places that are distant from major markets. If someone else is paying for transmission, the rational generation business will be indifferent to its costs thus distorting the efficient trade-off transmission costs and generation costs.
It is argued that the externalities are too great to allow profitable merchant transmission since the benefits of lower prices (actually arbitraged prices) accrue to all and not only to those paying for the asset. However, this is not markedly different from the situation concerning a new generation facility, which will tend to suppress the price of all delivered electricity in its interconnected region. Few would argue that by analogy all generation should therefore be government owned or subsidised even though many argue for a form of general overhead support in the form of capacity payments. The fact is that supply across the economy is seldom unaccompanied by some externalities.
Associated with the claim that transmission would be inadequately provided in the absent of it being made subject to regulated support, is the contention that a transmission line has market power and its prices should be regulated. However, for the most part, transmission inter-ties or inter-connects offer no more market power than that of a significant generator portfolio. Inter-ties in Australia can account for some 35% of supply (Victoria to South Australia) but normally provide much less than this. Their market power is confined to influence over those wishing to export and such firms are normally capable of writing contracts to cover and vulnerabilities they foresee.
Issues on how best to allow expansion of transmission, especially in terms of the regional linkages has been subject to heated debate in Australia. An uneasy compromise is presently in place for transmission under which regulated links will be permitted as long as a net market benefit is judged by the regulator to be the outcome and as long as the proposed link is the best of a range of feasible alternatives. This, however, remains dissimilar from the decision making structure that is seen in the generation sector or in markets more generally since it may incorporate some to the network benefit externalities which an comparable investment in a new generator would not capture.
The competing solutions that generation and transmission often offer mean disputes about the merits of a new transmission solution are likely to remain. These may be exacerbated since the Queensland Government has encouraged new government owned capacity to be built in that State, driving down prices below those in NSW and is seeking to augment transmission links. Other states regard this as facilitating dumping and are opposing to having expanded capacity financed as a regulated link since most of the costs fall directly on consumers.
These considerations have been further complicated by the growth of subsidised wind generation. Wind power is always likely to be relatively dispersed and remote and, in addition to production subsidies, its sponsors have already extracted concessions from some governments that smear its transmission costs. Over a thousand MW are planned in South Australia where conventional capacity is only 3000MW.
2.8. NETWORK PRICE SETTING
The ACCC is responsible for setting prices for electricity transmission lines (as well as those of gas). Local State regulators at the present time are responsible for setting distribution prices.
The price setting process has assumed a vast complexity as the regulator and the businesses each hire accountancy and economics advice to determine the appropriate prices. Regulated businesses are never likely to express satisfaction with the determinations of a regulator, but for the most part over recent years the outcomes have been more predictable and less contentious. There remains the risk that price cuts can induce sub-optimal investment. In Victoria, following a price reduction on distribution businesses averaging 15% in 2001 further real price cuts averaging 14-26% are proposed for 2006 when the businesses claim that all the fat was cut out in the first price re-set.
In the case of gas transmission emerging competition is generally to be seen across the country. In spite of this, the ACCC has been seeking to maintain its regulatory powers and its decisions have been at variance with those of the market itself. Both the Minister for Energy, (13) who has review powers over certain ACCC decisions, and the Productivity Commission, (14) the advice of which has been sought by the government, have suggested that the ACCC's powers be curtailed somewhat where, as is evidenced with gas, competition is itself providing adequate market disciplines.
The danger of a regulator setting transmission prices too low is that this will result in inadequate new investment. Setting prices too low on existing network facilities (transmission and distribution), irrespective of any general provisions that are in place to maintain quality, will also result in inadequate maintenance. A claimed outcome of mandated price cuts by the Queensland regulator was a series of blackouts in 2004.
On the other hand is the risk of setting regulated transmission returns too high. Where these are provided by compulsory charges there is likely to be over-building with the previously discussed adverse impacts on alternative, more efficient solutions like additional local generation capacity. This has been foreseen in the NEM Code which has provisions for rationalising redundant facilities. These however are difficult to activate.
3. OPERATIONS OF THE NATIONAL MARKET
3.1. THE SPOT AND CONTRACT MARKETS
The Australian National Market is underpinned by a "gross pool" system under which all major suppliers must bid. There is no capacity payment system and the market for energy is linked and simultaneously cleared to eight separate markets for reactive power and other "ancillary services".
Although virtually all power must be bid into the pool (a major exception being wind power, which must be taken as it comes) few customers or suppliers would find it prudent to rely solely on pool prices. In effect the market is now a multiplicity of bilateral contracts between generators and retailers, usually in the form of contracts for difference, strongly underpinned by the "gross pool". Essentially the NEM is a one-way market with the demand emerging from whatever end-users require and with supply being offered by generators at different price levels.
Through the pool, all supply is paid the same price, that of the highest bid supply that is dispatched. In the short term, generators are relatively indifferent to the price of that part of their supply for which they have contracts (probably 90% plus of the market) and will usually bid close to their marginal costs for this part of the load. (15) Compared to a price norm of about $A30/MWh, at present prices can rise to as much as $A10,000/MWh which makes retailers especially keen to be fully contracted or to manage spot exposure through ownership of peaking capacity.
A complex National Electricity Code controls the rules under which generation and transmission are placed on the market. Generators bid in a maximum of 10 price bands and although there are restraints on price re-bidding, there are none on shifting energy between different price bands meaning, in effect, that prices can be changed at any time prior to 30 seconds of dispatch. Each generator has controls built into the dispatch algorithm covering ramp rates and minimum loads.
Loads can also bid to be offloaded though few do. In some cases this is due to lack of "smart" metering though it is likely that only those users, for example smelters, who have energy as a very large share of their aggregate costs would consider it worthwhile to make savings by shutting down and re-starting. It is an assumption of those calling for mandatory roll-outs of smart meters that this will markedly influence household behavior. It is, however, likely that any such influence would be in the form of contracts that suppliers arrange with households for automatic partial disconnect for short periods. How prevalent these will be is open to conjecture.
As an insurance against inadequate capacity, there is a (supposedly temporary) provision for a "Reserve Trader". This entails NEMMCO seeking additional supply offers (or demand side offers) in the event of it determining that a shortfall will occur in forward supply. Such a shortfall would be determined from forecasts of maximum capacity 2 years ahead that generators are required to provide, forecasts that are married to NEMMCO's own demand forecasts. Under current standards, which are a combination of N-1 and unserved energy standards, NEMMCO is required to ensure 850 MW of reserve is carried across the entire NEM - including during the periods of extreme demand - to provide the required level of supply reliability.
Though the Reserve Trader provisions have in fact been used, they have an intrinsic deficiency in that they simply call forth supplies that are available in any event. No government body would contemplate building additional capacity solely for reserve purposes. Reserve Trader capacity, therefore simply adds to costs unless the market manager has superior prescience to the various market participants. This is because, absent the government intervention, to the degree that supply shortfalls emerge, prices will be driven up and suppliers have every incentive to make plant available that was formerly mothballed, due for scrapping or being restrained to economise on maintenance.
Moreover, a Reserve Trader policy carries seeds that can distort the entire market. If the Reserve Trader is in place and is offering higher prices than those anticipated by market participants, a rational generator will withdraw capacity thus exacerbating the apparent future shortfall. If such actions were to snowball, there would be a progressive increase in the apparent shortfall and an increasing need for the authorities to contract outside of the normal market, thus undermining it.
3.2. MARKET INTEGRATION: ACCESS TO TRANSMISSION
Although Australia does not have a nodal pricing system, there are procedures in place that in principal, lead to new regions being created when areas are islanded with significant price separation for more than 40 hours/year. However, political pressure has prevented new regions being created, notably in Queensland where the entire state remains a region in spite of considerable transmission weaknesses between the populous south east of the state and the northern parts.
Loss factors for transmission and capacity constraints mean that there may be significant differences in the spot price for any trading interval across NEM regions, though market separation rarely occurs for more than an hour or so. Once a region is created, inter-regional settlements are auctioned.
These settlements represent the difference between the value of electricity in the region where it is generated and its value if sold in another region. The settlement residue that accumulates is made available to the market by the conduct of an auction. Holders of this auctioned revenue value have a form of hedge that contributes to facilitating inter-regional trade by providing market participants a risk management mechanism as protection against high prices. The risk is however not eliminated since if the link constrains, revenues are not able to benefit fully from high prices in one region because of volume shortfalls.
3.3. ISSUES CONCERNING GENERATOR MARKET POWER
Market supplies in Australia have on the whole been sufficiently disaggregated to prevent monopolistic power to be exercised other than on a transitory basis.
In the interconnected NEM of six regions, the largest generation business has only 14% of the market and two other businesses each have over 10%. Concentration is somewhat greater in individual regions and these sometimes have constrained interconnects.
Three businesses have 10% or more of the national market's capacity (one of which, Snowy, is a hydro generator with the maximum annual output equal to about one quarter of capacity). A further 11 businesses each have 2-8% of the capacity market while a host of smaller suppliers collectively account for about 10% of the market (Fig. 5).
Fig. 5.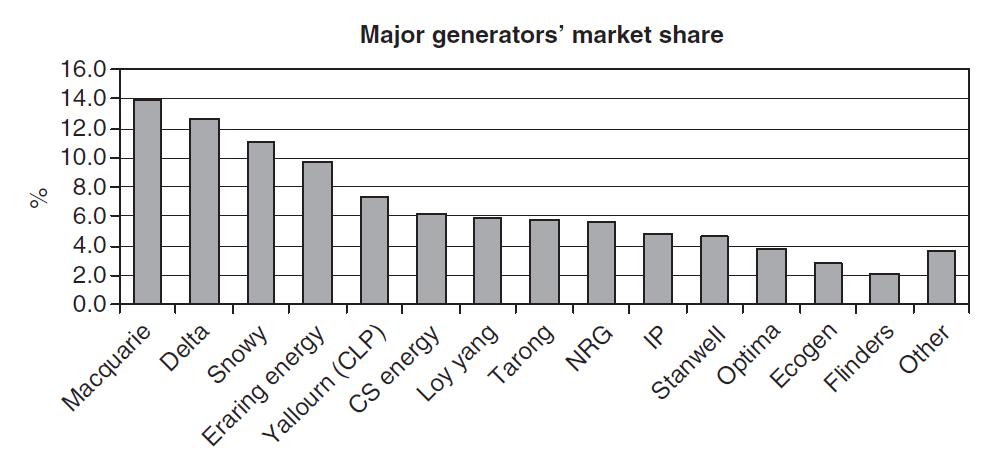 Source: NEMMCO.
In some states the capacity is more concentrated. Thus, NSW has three baseload generators (all government owned) controlling 70% of capacity and it is claimed that they have used market power on occasion to ensure that the mandatory insurance system for retail prices created by government regulation (and discussed in Section 7) does not accumulate income. NSW market shares are shown in Figure 6.
Fig. 6.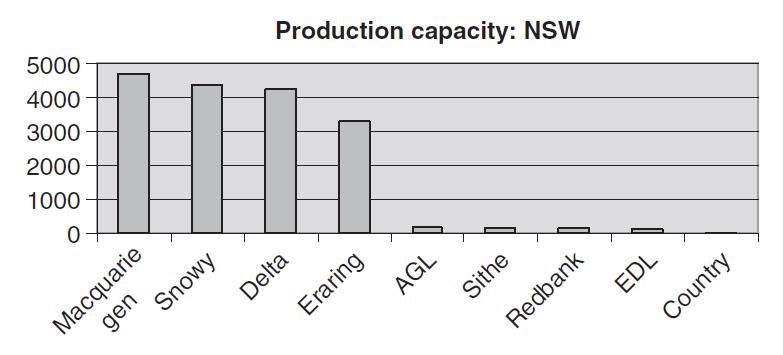 Source: NEMMCO.
In addition to this level of market supply, there are two transmission links from Queensland, theoretically rated at a combined 880MW.
In Victoria and South Australia, which have strong transmission capacity links with each other, the market supply includes that which can be transferred through Snowy either from the hydro facility itself or from NSW power suppliers. As from early 2006 a further transmission connection from Tasmania will operate with a capacity of 300 MW into Victoria and 630MW into Tasmania. Even though CLP has over 30% of the capacity, there are several other powerful suppliers and there are few concerns about abuse of market power (Fig. 7).
Fig. 7.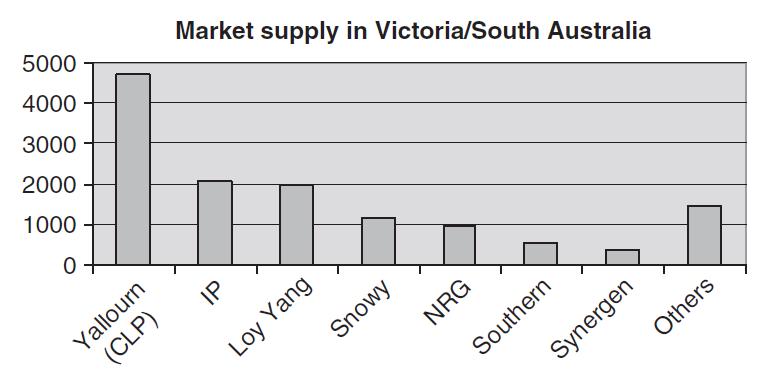 Source: NEMMCO.
The fact that there is so much flexibility in bidding under the Australian system has contributed to unease in certain quarters that price oscillations have been due to supplier market manipulation. Of course, such price oscillations have always been present - they are inevitable because of the wide and sometimes rapid variations of demand (and occasionally supply). They were masked in the past because the monopoly provider called in higher merit order plant to cover peaks or sudden needs without this actually being specifically priced.
The sharp oscillations in price now visible have led to claims that the generators are unfairly "gaming" the market, driving up prices to take advantage of opportunities in which there is a monopoly. A lengthy series of investigations into the structure of the bidding rules was underway between 1999 and 2002. Similar debates were held in the UK and other countries.
In the event there was recognition that temporary market power is common to many industries and that attempts to combat it by fixing or constraining prices could exacerbate the underlying conditions that create it. Thus an ability to earn very high prices from being able to react quickly to opportunities or provide capacity in an area that can become islanded and subject to sudden price surges/supply shortfalls tends to encourage desirable investment behavior. Requiring a window of several hours between bid and dispatch would frustrate this.
By the same token, preventing firms from reacting quickly to cover their contracts in the event of an unexpected outage is likely to result in over-cautious holding back on capacity and higher costs. The abandonment of proposals to place restraints on re-bidding close to dispatch was influenced by observations that most of the very late changes to price in the market had been price reductions. These reflected decisions by marginal suppliers to bring plant on line in response to market opportunities that were unfolding (due to a demand surge, network constraint, etc.).
Following the various investigations into market power, changes to the Code were made to recognise the possibility that a supplier could bid erratically and benefit from creating great instability to the market. (16) Hence rules were tightened to require some explanation of re-bidding behavior. These changes were more of the nature of increased insurance against aberrant bidding behavior rather than affecting bidding patterns themselves.
3.4. PRICE OUTCOMES IN THE WHOLESALE MARKET
The resiling from major changes to the market rules was made more acceptable in view of the very low prices that had on average prevailed in the market.
Compared to a notional wholesale price pre-market of around $A38/MWh in Victoria and $A40/MWh in NSW, competition has maintained average prices at low levels, below $A35 for most of the period. Higher prices prevailed early in the Queensland and South Australian regions as they were being bedded down. Table 3 illustrates the price developments in each of the regions.
Table 3. Average price ($A/MWh).
| Year | NSW | QLD | SA | SNOWY | TAS | VIC |
| 1998-1999 | 33.13 | 51.65 | 156.02 | 32.34 | 36.33 | |
| 1999-2000 | 28.27 | 44.11 | 59.27 | 27.96 | 26.35 | |
| 2000-2001 | 37.69 | 41.33 | 56.39 | 37.06 | 44.57 | |
| 2001-2002 | 34.76 | 35.34 | 31.61 | 31.59 | 30.97 | |
| 2002-2003 | 32.91 | 37.79 | 30.11 | 29.83 | 27.56 | |
| 2003-2004 | 32.37 | 28.18 | 34.86 | 30.80 | 25.38 | |
| 2004-2005 | 39.33 | 28.96 | 36.07 | 34.05 | 190.38 | 27.62 |
| 2005-2006 (2 months) | 26.68 | 19.48 | 32.36 | 27.33 | 110.63 | 28.61 |
Source: NEMMCO.
In addition, the forward price has tended to be stable, though edging up beyond the $A40 level by the end of the current decade, indicating a need, though not a pressing one, for new plant since at such prices new coal-based plant investment is profitable in Queensland, NSW, and Victoria. A synthetic forward price is published with the following indicative price for baseload energy (Fig. 8).
Fig. 8. Forward baseload price.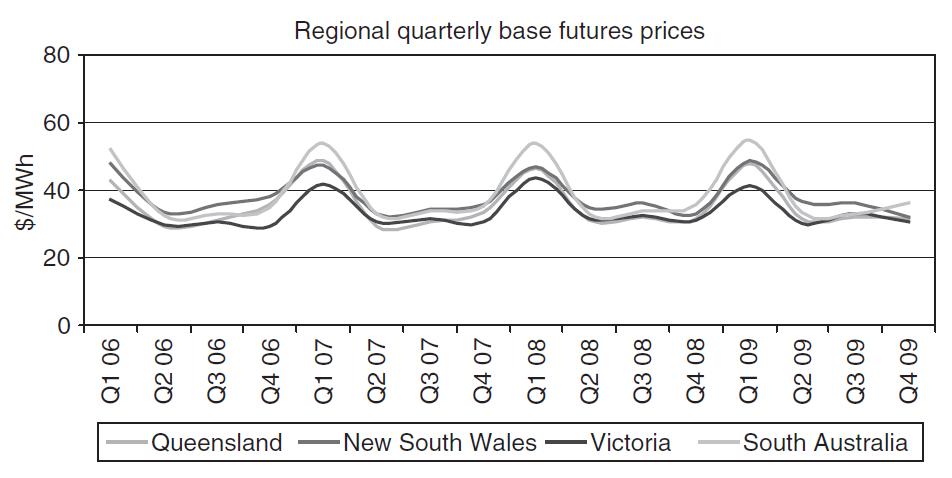 Source: NECA.
4. PERFORMANCE OF THE REFORMED ELECTRICITY MARKET
4.1. GENERATION
The outcome of Australia's reforms has been considerable improvements in productivity. In the case of power stations, increases in labor productivity since 1990 have ranged from a fivefold improvement in Victoria to a 50% improvement in Queensland, where it is generally acknowledged that power stations were operated more efficiently at the outset. Although there has been some new construction, the stock of generating capacity has not markedly changed over the period. Figure 9 illustrates the improved productivity.
Fig. 9.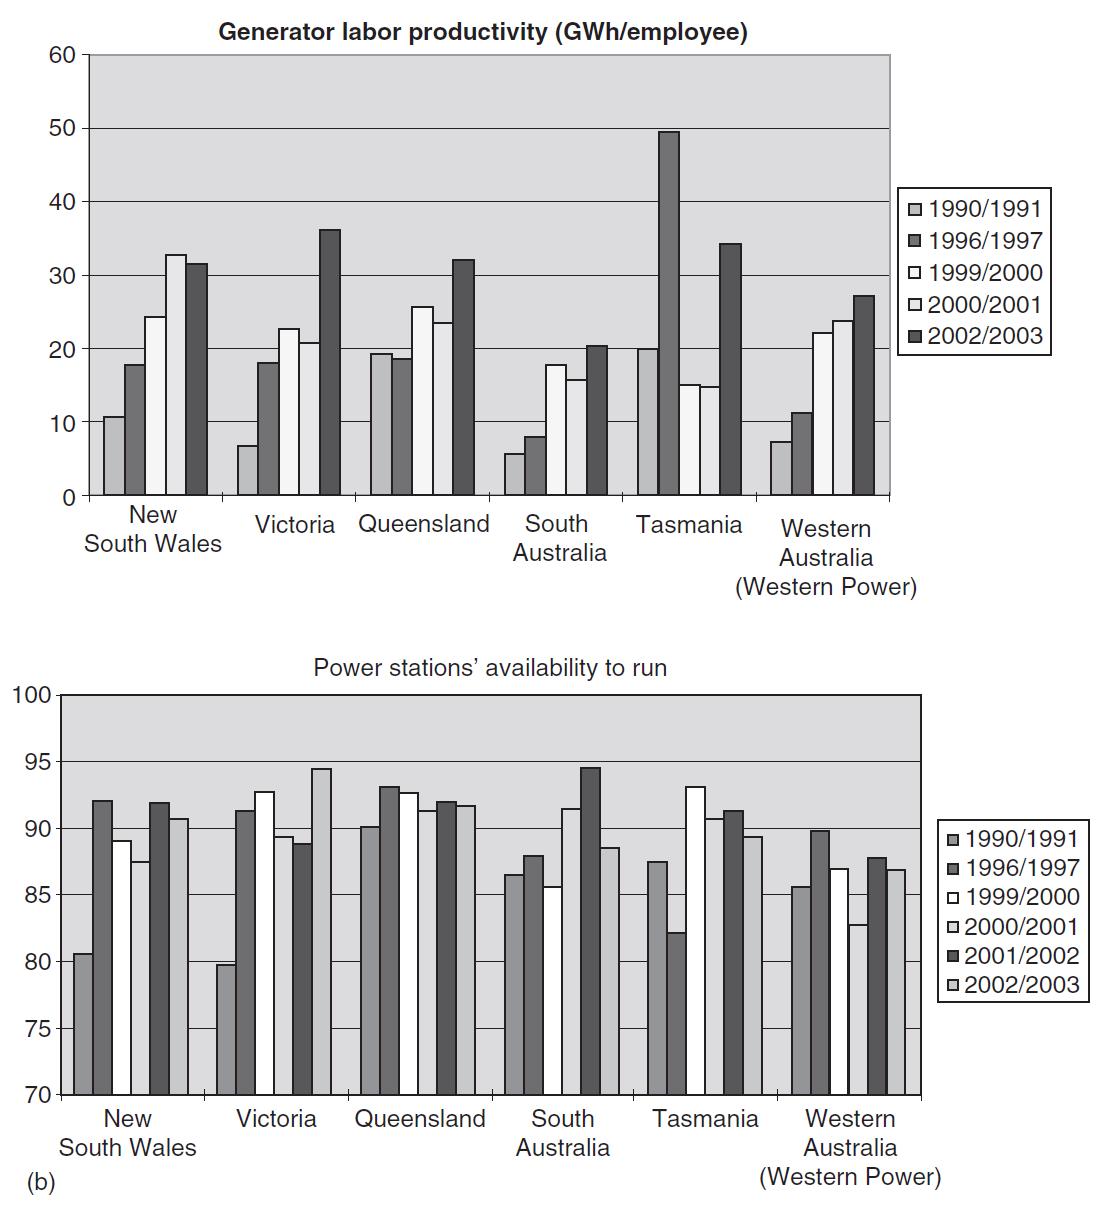 Source: ESAA.
In spite of these vast improvements in labor productivity, Australia's power stations have also shown much greater reliability. As illustrated in Figure 9, the "Availability to Run" has improved in all of the States but especially in NSW and Victoria. This in itself has raised the de facto capacity of the industry.
The comparisons indicate a relatively better performance on the part of those states that have privatised their businesses. In the privatised Victorian and South Australian systems, labor productivity has respectively increased fourfold and threefold. NSW with its government owned generation business and Queensland, under predominantly government ownership, have seen more modest increases - twofold in the case of NSW. In terms of labor productivity and plant availability, the privatised Victorian system now surpasses the performance of the state owned NSW system. This is in spite of Victoria having the disadvantage of relying predominantly on brown coal, which requires greater processing before being burned than black coal, which is the fuel source of the NSW system.
Part, but by no means all of the relative Victorian improvement is due to greater use of contractors in the privatised firms. Moreover, to the extent that NSW uses fewer contractors this is likely to be a reflection of its shareholder's preferences for union labor and would contribute, of itself, to lower levels of efficiency.
There is also some indication of improved capital productivity in the privatised businesses. In particular, privatisation brought a new lease of life to International Power's 1600 MW Hazelwood brown coal generator in Victoria. The station had been previously scheduled to close in 2005 but has had its capacity increased and now likely to operate for another 20 years.
4.2. DISTRIBUTION
As with generation, distribution, which accounts for over 40% of final costs, has shown strong productivity improvements. Figure 10 shows that customers per employee in Victoria and NSW have almost doubled and all states, bar Queensland, have shown impressive gains.
Fig. 10.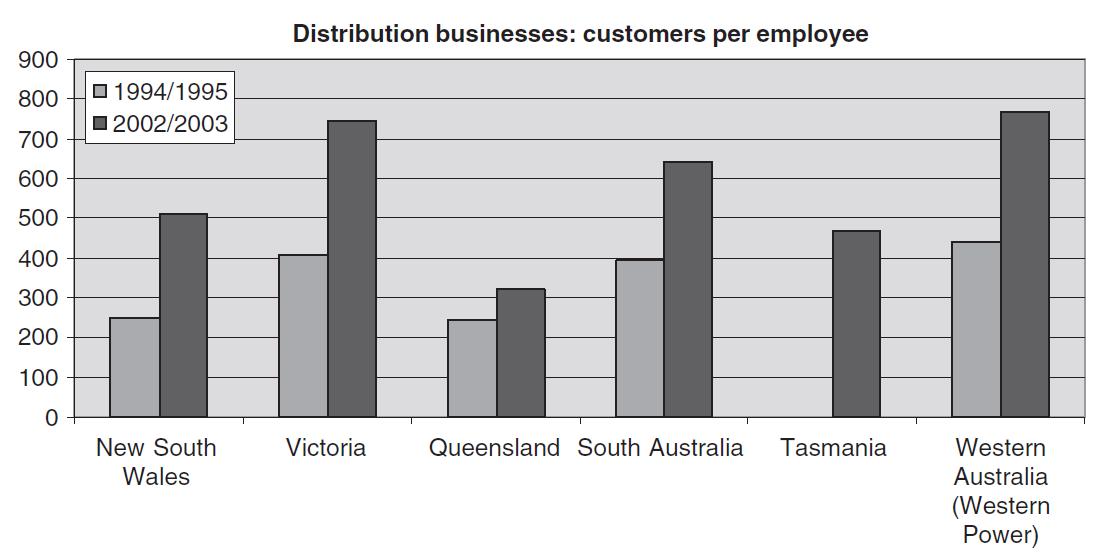 Source: ESAA.
Again Victoria shows impressive labor productivity (the Western Australian system applies only to the interconnected, relatively urbanised system).
In terms of outages the system performance has been mixed - in most areas outages are heavily influenced by occasional severe storms that do not occur with any degree of regularity. Figure 11 below indicates that outages have generally remained low and shown little trend, except in Victoria where they have been reduced and become comparable with outages in other states.
Fig. 11.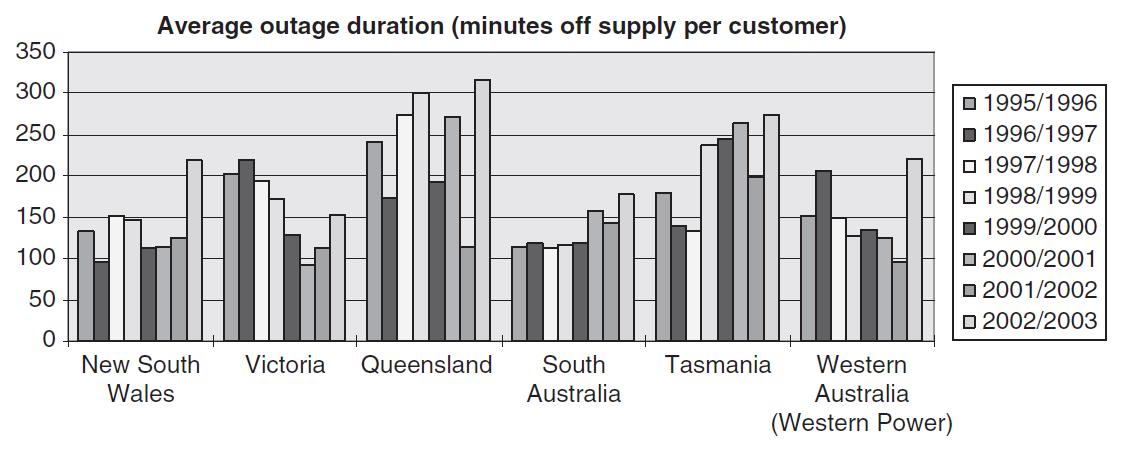 Source: ESAA.
4.3. CONSUMER PRICE OUTCOMES
Price level comparisons are distorted by the previous, and for households to a major degree on-going, regulation of maximum prices.
Household retail price controls have suppressed prices in all states, though in recent years price controls have been eased or been allowed to rise in response to regulated increases permitted in line charges. This is especially the case in South Australia, where electricity costs are intrinsically higher than in other states and where the load profile is more skewed towards the summer peak than in other states. Household consumers' prices in NSW and Queensland remain under relatively tight government control and are below those that would prevail in a commercial market.
Over the past 7 years real prices for residential consumers have risen by as little as 9% in NSW and as much as 52% in South Australia. Those in Victoria have risen by 15%. As expected from a system with access to low-cost energy inputs, Australian prices remain among the lowest in the world.
Business customers have been freed from price controls for several years. In the past, the business customers subsidised household customers but once the market became contestable this was no longer possible. As a result, real prices for business customers have fallen by over 23% in the three eastern states; they have risen about 2% in South Australia.
Figure 12 below illustrates the trends.
Fig. 12.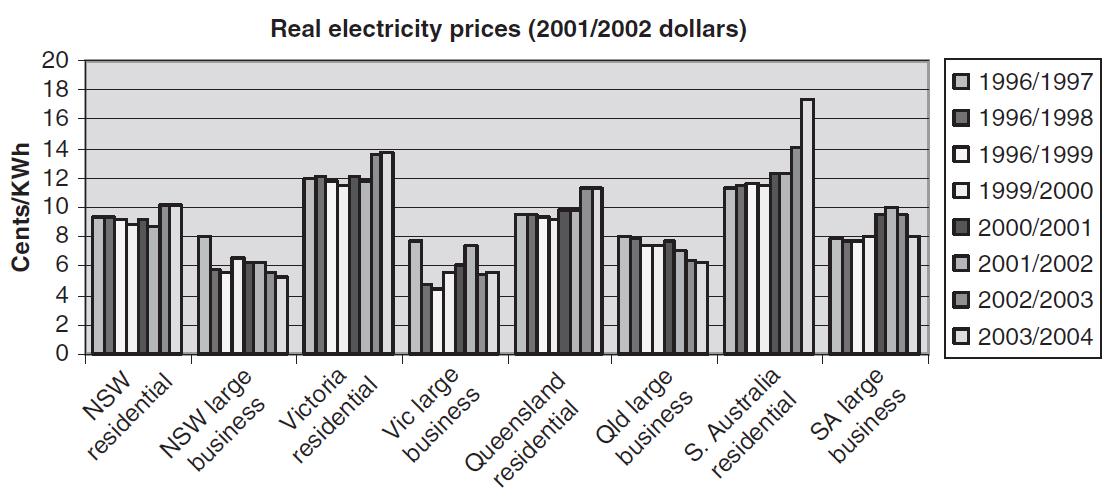 Source: ESAA.
5. ISSUES CONCERNING PUBLIC AND PRIVATE OWNERSHIP
The post 1990 period in Australia has seen dramatic improvements in the productivity of the ESI. Initially these strides were made under public ownership with reform of the over-staffed integrated utilities and their incorporation under company law.
A further productivity improvement took place with the privatisation of the Victorian industry from 1997. State owned businesses generally adopted many of the labor saving and production enhancing measures of their private sector counterparts. However the fact that the Australian industry remains mostly under public ownership carries several potentially damaging consequences.
The first of these is the intrinsically greater incentives to save on costs that are present in privately owned businesses. Part of this may be due to government as the shareholder and appointer of the company boards, is more reluctant than a private company to shed labor; allied to this is close links that the Australian State Governments owners of the electricity businesses have with trade unions. This means they are reluctant to allow non-union labor and keen to ensure that union rights and privileges are maintained. In the main this will reduce the capacity of the managements to manage. The evidence available in Figures 9-11 indicates that the efficiency levels of the private sector businesses exceed those of the public sector firms.
Public ownership also impedes firms from re-arranging their assets. All of the private sector businesses post-privatisation have undergone several structural changes as parts of them have been spun off, other parts have been augmented and some have undertaken major new investments. Private sector businesses, in search of operational economies and improved shareholder value have re-arranged asset ownership so that activities are better grouped together. In the case of the distributor/retailers, this has led most of the private sector to have the two functions separated and housed in differently owned firms, whilst none of the public sector businesses have taken such steps.
The public sector businesses need to approach their government shareholder for approval of any new capital investment. These decisions face the familiar issues of government decision taking. In New South Wales for example, the State Government has adopted an anticoal philosophy on greenhouse grounds (in June 2005 the "ecologically friendly" then State Premier even opened up the debate on nuclear generation, a debate that had been dormant due to opposition by green groups and because cheap coal offers a more economic baseload solution).
By contrast to the NSW Government's restraint on new investment, it is claimed that the Queensland State Government is accepting a lower than commercial rate of return in order to encourage the building of new power stations. It is certainly the case that most new capacity has been built in Queensland and about 60% of this has been government financed but Queensland also has the fastest growing load and has the cheapest coal. In this respect, data for Queensland (Table 3) shows spot prices were one third less than in NSW in the early part of 2005/2006. This may offer some corroboration of the over-build of generation in the State; however, the spot market data does not appear to be reflected in higher contract prices (Fig. 7).
Whether or not Queensland new generation investment has been fully justifiable on profit grounds, public ownership adds a non-commercial dimension into the industry which diminishes the predictability of private firms' competitive environment. Other things being equal, this brings additional business risk, excessive conservatism and higher prices/lower reliability.
6. GOVERNMENT MARKET INTERVENTIONS
6.1. MANDATORY INSURANCE SCHEMES
Public ownership leaves governments with greater political vulnerability in the event of poor decision making. Hence decisions by both the NSW and the Queensland Governments to implement a form of mandatory insurance for the supplies to household retail customers.
This, called the Electricity Tariff Equalisation Fund (ETEF) in NSW, tends to blunten the market forces through reducing apparent retail risk by having the government assume much of it. One outcome is price suppression, especially for peaks, and a muted demand signal for new investment. ETEF operates by placing a ceiling and floor on wholesale prices as they impact on the household part of the aggregate load. When prices are high the generators receive only the stipulated price and reserves are accumulated in the fund; these are released when spot prices are below the floor set for the fund. As well as creating an insurance risk for the state, it is likely that such measures also impede the market for various financial instruments, the depth of which in NSW lags considerably behind Victoria.
Although having similar features, the Queensland scheme, called the Long-term energy procurement or (LEP), has been designed with the aim of increasing liquidity and market depth by encouraging the incumbent retailers to actively seek contract cover for the franchise load. That is, the structure of the LEP is such that the incumbent retailers are exposed to energy price and volume risk and have incentives to manage their position through contracting, with compensation provided for efficient purchasing against a benchmark.
6.2. RETAIL PRICE CONTROL
Retail prices to business consumers have been deregulated in all states but all retain some controls over household prices. In the case of Victoria and South Australia, these controls are not considered to be significantly in excess of underlying market prices, and in both states there has been significant customer churn. This is also true to some degree of NSW and to a lesser extent in Queensland.
For electricity, retailers need to balance their demand and supplies and act as the agent of the final consumer. They pick up the tab when the price spirals out of control and this gives them a great incentive to ensure they measure their sales correctly and contract for supplies appropriately. They perform the same essential function in the energy market as elsewhere - they look to demand, seek to attract customers who they can profitably supply and package supply to meet their customers' needs. The outcome is signals that drive efficient market activity. These signals include the prices that attract the right form of new supply (peak, off peak, etc.) They also develop prices that choke off or encourage increased demand.
Of course, all this is made more difficult in the ESI. The absence of half hourly metering at the domestic level and the price cap are among the market realities that prevent this from operating with full effect. Even so, the residual retail price controls dampen the economic signals that businesses need to determine the optimum time to invest or undertake other strategic decisions.
6.3. GREENHOUSE GAS ABATEMENT SCHEMES
Australian coal is inexpensive and located conveniently to major electricity loads. However, its economics change markedly in a Kyoto constrained electric power future, whether the measures in place to reduce carbon dioxide emissions are a form of cap and trade regulation, a carbon tax or even a more arbitrary set of regulations that have similar effects.
Australian measures ostensibly aimed at reducing emissions of carbon dioxide appear in many forms and are inconsistent from one State to another. They impact most heavily on coal, Australia's lowest cost energy source and include:
- the federal government's mandatory renewable energy target (MRET),
- the Queensland's 13% gas target,
- the NSW's Greenhouse Gas Abatement Certificate (NGAC) scheme,
- subsidies to wind and other exotic renewable sources offered through the Australian Greenhouse Office and state governments (the latter in the form of regulatory measures that reduce connection costs to wind generation), and
- schemes that mandate minimum energy savings on appliances. First applied to fridges and freezers and targeted at energy conservation, these regulatory requirements have been re-badged as greenhouse measures and extended to include houses as well as other appliances.
The MRET scheme's focus is on renewable energy and requires retailers to acquire and annually surrender a progressively increased number of Renewable Energy Certificates (RECs). These essentially require usage of novel energy sources like wind, though some existing and expanded hydro capacity has managed to redefine itself to be eligible. By 2010, 9500GWh (around 4.5% of demand) will be required under the MRET scheme. For the three schemes combined over 30,000 GWh is estimated to be covered amounting to over 13% of total demand. (17)
The Queensland scheme seeks to substitute gas for coal-based electricity inputs. The NSW scheme seeks to introduce a penalty on carbon dioxide graduated in line with the emissions per unit of energy of each electricity generation source.
The default penalty costs of the three regulatory measures provide a cap on the costs they are likely to entail. These costs entail a premium over the costs of conventional electricity to retailers. By 2010, when the schemes are at full maturity, the fall-back penalty rates for the Commonwealth, NSW and Queensland schemes respectively are $A40, $A14.3 and $A13.1/MWh. These rates provide the (maximum) subsidies to the non-carbon or low-carbon emitting fuels. The Commonwealth's RECs during 2005 were trading 20% below the maximum rate.
Table 4 below summarises the more readily identified costs.
Table 4. 2010 Costs of greenhouse gas support measures.
| MRET | NSW NGAC | Qld 13% gas | Commonwealth subsidies | State subsidies | |
| $AM | 380 | 222 | 68 | 124 (2006/2007) | 32 (2004/2005) |
Source: Budget documents.
A greenhouse trading regime has considerable support in Australia, with most state governments urging its national adoption. Figure 13 below estimates the costs of electricity with and without the sort of additional charges implicit if Australia adopted the EU cap and trade scheme and other schemes are left in place.
Fig. 13. Australian power generation costs with EU tradable rights prices.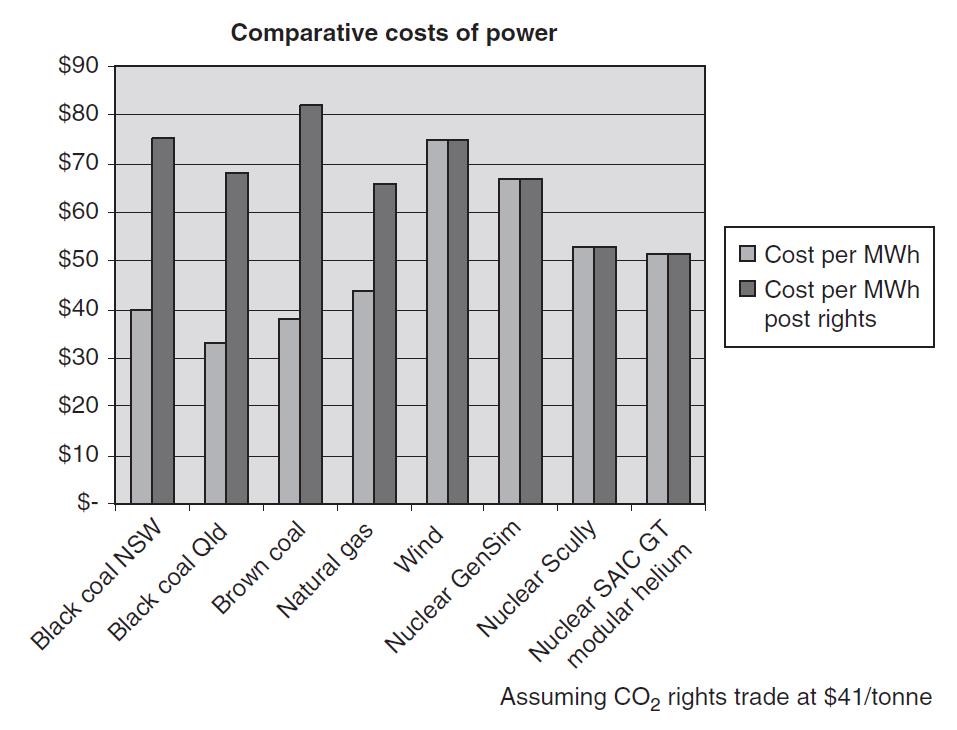 Sources: Australian costs are based on recent estimates. Nuclear power costs are based on University of Chicago, The Economic Future of Nuclear Power. Carbon emissions per gigajoule of energy is derived from http://www.greenhouse.gov.au/workbook/pubs/workbook.pdf
Based on recent developments, we have relatively good information on the costs of conventional generation for the eastern seaboard of Australia. Nuclear costs have been rigorously evaluated in a recent University of Chicago report that brought together three contemporary estimates of the costs of nuclear generation (excluding the disposal costs). The models compared are the Shanghai automotive industry corporation (SAIC) industry model, the Scully Capital financial model, an Energy Information Administration (EIA) model and GenSim, which is based on the EIA approach. (18)
Wind power costs are also relatively well known. The price cited below ($A75/MWh) represents the costs at prime sites. These costs exclude any additional transmission charges that may be required for the more remotely located facilities. They also do not take into account the need for conventional power back up which is necessary once wind, with its unpredictable and intermittent nature, becomes a significant component of the aggregate supply.
At present, coal-based generation costs is estimated to vary from about $A32/MWh in Queensland, (19) around $A40 in NSW and $A38 in Victoria. Gas is estimated at around $A45/MWh based on a cost of $A4/Gigajoule, a cost that may rise if greenhouse measures raise the demand for gas. Nuclear costs exclude waste storage, the estimated costs of which vary. One estimate by the Uranium Information Centre puts the decommissioning costs as adding 5% to the price and waste disposal a further 10%. (20)
Applying the EU price of euros 24/tonne of carbon dioxide, cost to current power sources would result in nuclear power based on some cost estimates becoming marginally cheaper than coal and natural gas generation.
Government greenhouse mitigation policies and laws have also been used by advocacy groups (themselves often government financed) to tie up new proposals in the courts. The highest profile case, which is discussed below, has been the NSW State Government using greenhouse policies to maneuver itself out of a (high-priced) contract for a new generator designed to use waste coal. Other cases have included the prevarication of the Victorian Government in granting approval for a major power station to have its life extended.
Snowy Hydro illustrates an outcome of subsidies that cannot or are not fully defined to meet their stated goals. Snowy has been given an annual baseline level of generation above which it earns RECs that have a default value of $A40/MWh. Because it does not receive penalties for underperforming, it operates its system to generate strongly in 1 year and build up its reserves for the next year. This allowed Snowy to earn about $A67 million in essentially phantom RECs in 2003.
Not only did this not contribute in net terms to the government policy of reducing greenhouse gas emissions, it actually increased emission levels. This is because 20% of Snowy's RECs may have been created through pumping water uphill for reuse. Though the energy used in pumping is netted out from the REC creation, shifting water from an underperforming year to a hard generating year creates a credit. In pumping water uphill, Snowy uses almost twice as much (coal-derived) energy as it produces in subsequent generation.
6.4. SOVEREIGN RISK
One further facet that is not considered in the comparative cost data is the sovereign risk involved in building fossil fuel power stations, especially involving coal. The activities of the NSW Government in using environmental pretexts to renege on coal-based contracts and the additional costs the Victorian Governments have required of the Hazelwood Power station upgrade proposals are likely to require a risk premium for coal powered electricity.
The NSW Government has created obstacles and uncertainties in the way of new electricity generation. These make it inevitable that investors will require a risk premium before committing funds, thus increasing the price of electricity in the state and the risk of shortages.
One example of this was the government's treatment of a private sector investment undertaken by the US firm National Power. This stemmed from a commitment - in the event an unwise commitment - by energy Australia, the biggest retailer in the NSW for two power stations, Redbank 1 and 2.
Soon after the deal was struck, the price in the market halved and remains 30% below the Redbank contract price. Some estimates put the contract loss at $A750 million. To renege on the deal for the second power station, the NSW Government set up an inquiry into it. Various Government funded green groups offered opposition to the project on grounds of its greenhouse gas emissions and the Government refused its development approval, thus avoiding an onerous contract. In fact opposition to the development on environmental grounds is ironical since the project uses waste coal which could otherwise pollute the Hunter River. Indeed, in 2001 Redbank 1 won the Institution of Engineers Award for Environmental Excellence.
The Government's performance on this matter must add to the risk premium required of private sector developers of power stations and will probably require some enforceable undertakings before any private funding is extended to coal-based generation in the state.
In addition, private sector investors, especially in coal-based generation, would hardly be re-assured by the statements the NSW Government makes in a Green Paper issued in January 2005. (21) This expresses considerable hostility to new coal power, canvasses greenhouse taxes and a policy (p. 24) by mid century ranging from stabilisation of emission at current levels to reducing them by 40%. In terms of a business-as-usual growth in energy demand at 2%/annum, this range of outcomes would amount to a highly ambitious reduction of between 60% and 75% in emission levels. In claiming in concert with this, that the Government will let the market decide which technologies should be developed, the Green Paper is giving expression to grand sounding laissez-faire principles that clothe a highly intrusive policy approach. The Green Paper, due to proceed to a White Paper stage by June 2005, had not so progressed by October 2005. In the interim, the State Premier, Mr. Carr who was highly supportive of greenhouse gas reducing initiatives, unexpectedly retired.
7. OUTCOME OF AUSTRALIAN ELECTRICITY MARKET ARRANGEMENTS
7.1. SUMMARY OF MARKET DISTORTIONS
Aside from sovereign risk associated with government de facto expropriations as occurred in the NSW Redbank case, distortions that could lead to serious market damage include:
- The NSW mandatory insurance system or ETEF, provides a weaker incentive for retailers to ensure that they are forecasting market demand accurately. ETEF means the government has eliminated the risks to retailers of failing to forecast the household load accurately. This may bring mistakes caused by unexpected demand shifts.
- Retail price caps being kept below market levels. This is an area where governments in Victoria and SA have managed to control their propensities to intervene and are allowing prices to shift market levels. NSW however retains very low allowable retail margins, which seriously restrict competition.
- The risk that regulators will offer inadequate incentives for expansions and optimal maintenance. Major price reductions have been insisted upon by several state regulators. Regulated businesses are always likely to profess dissatisfaction at such outcomes but a risk remains that price cuts can deter investment. Such requirements may have been a feature of the fragility of distribution networks, especially in Queensland where the regulator demanded a 17% cost saving of the largest distributor, Energex, which was heavily criticised following power outages in 2005.
- Interventions favoring subsidised and uneconomic generation can suppress demand, which means reduced new investment especially in the sort of energy intensive industries that Australia is well placed to win. The various schemes like MRET and NGAC add costs to industry and in the case of NSW, mean that some 23% of electricity is now slated to be subsidised; this probably rules the state out of consideration for major new energy intensive industry. Less draconian measures are in place in other states - Queensland has its 13% gas requirement and Victoria was less than firm in controlling its state financed green groups who campaigned to prevent the Hazelwood expansion; nor has the state made a wise choice in its appointment of a relatively activist Presiding Judge to the Land and Environment Court whose legal interpretations prolonged the case and added expenses.
- Some private sector generation businesses claim that the new capacity building by the Queensland government is not based on commercial principles but are being subsidised indirectly by a government intent on using its cheap coal as an industry development tool. Though subsidised plant adds to capacity in the first instance, each new tranche of it considerably reduces the incentive of commercial parties to seek out opportunities to build plant in line with market requirements. Subsidised plant puts us on the slippery slide to total government ownership or control of the industry.
- Much the same risk has in the past been offered by subsidised transmission. If a power station is stranded by low-cost power being brought in from elsewhere it suffers lower than expected returns. If this is due to it being stranded as a result of government regulations that effectively subsidise costs, damage is done to the market's automatic ability to supply demand.
- Finally, there remains the risk of other interventions. Australia has not moved to create trading barriers in response to fears about market power being exercised in re-bidding. Such measures would create major uncertainties by constraining generators' abilities to respond to sudden emergency issues, would have gummed up the bidding system and created costs and uncertainties.
7.2. OUTCOMES IN TERMS OF NEW CAPACITY AND PRICES
Notwithstanding the adverse effects of government intervention in Australia, a successful outcome has been observed. Prices are lower than expected, reliability has been high, and although the most market exposed sector, generation, has seen very low returns, new investment has been forthcoming. And the investment that has been made broadly corresponds to that which most experts expected: increased peaking capacity in Victoria and South Australia and more baseload to meet the faster growing Queensland demand.
This demonstrates a resilience in markets. As long as the various participants in the market are free to contract with each other and as long as there is no significant monopoly over supply, interventions may not seriously distort the market and lead to its failure.
Aside from wind power, which is totally dependent on subsidies, significant new power facilities built over the past 5 years are as shown in Table 5.
Table 5. New capacity 2000-2005.
| State | Capacity (MW) | Type | Ownership | |
| Redbank | NSW | 150 | Coal | Private |
| Bairnsdale | Vic | 92 | Gas | Private |
| ValleyPower | Vic | 300 | Gas | Private |
| Somerton | Vic | 160 | Gas | Private |
| Laverton | Vic | 312 | Gas | Government |
| Loy Yang | Vic | 236 | Coal | Private |
| Oakey | Qld | 282 | Gas | Private |
| Millmerran | Qld | 852 | Coal | Government/Private |
| Swanbank E | Qld | 360 | Gas | Government |
| Tarong N | Qld | 450 | Coal | Government |
| Kogan creek | Qld | 750 | Coal | Government |
| Hallett | SA | 220 | Gas | Private |
| Pelican point | SA | 320 | Gas | Private |
| Ladbroke | SA | 80 | Gas | Private |
| Quarantine | SA | 100 | Gas | Private |
Source: ESAA.
Figure 14 illustrates how demand and supply have been fairly well synchronised over the past 6 or 7 years.
Fig. 14. Source: NEMMCO.
The message is that the real dangers to the supply industry in both gas and electricity in Australia are those stemming not from too little government but from too much. The industry has expanded and maintained low costs in the 6 years it has been operating. It is however fragile and government actions could seriously harm investor confidence and lead to ever increasing interventions to ensure investment keeps pace with demand. Such measures would gradually erode the massive lifts in productivity that has been observed over the past decade or so.
8. GLOSSARY OF ACRONYMS
ACCC = Australian Competition and Consumer Commission
AEMC = Australian Energy Market Commission
AER = Australian Energy Regulator
ESAA = Electricity Supply Association of Australia
ESC = (Victorian) Essential Services Commission
ESI = Electricity Supply Industry
ETEF = Electricity tariff equalisation fund
LEP = (Queensland) Long-term energy procurement
MRET = Mandatory renewable energy target
NCP = National competition policy
NECA = National electricity code administrator
NEM = National electricity market
NEMMCO = National electricity market management company
NGAC = (NSW) Greenhouse Gas Abatement Certificate
ORR = (Victorian) Office of the Regulator General
PC = Productivity Commission
QEC = Queensland Electricity Commission
REC = Renewable Energy Certificate
SECV = State Electricity Commission of Victoria
ENDNOTES
1. Helpful comments were received from many people including Perry Sioshansi, Paul Simshouser (Braemar Power), Darren Barlow (Ergon Energy) and Ben Skinner (TRUenergy).
2. Prices here are quoted in $A or cents, which refer to Australian cents. The Australian dollar is worth around 75 US cents.
3. Under the state owned vertically integrated monopolies, large, footloose users negotiated cost-based prices (below cost in the case of some aluminum smelting contracts). Household supply benefited from a cross-subsidy paid for in higher prices to most business customers. Since the market has been operating almost all business customers and many household customers have seen real price reductions.
4. NSW has a second pricing node in the snowy mountains scheme, however there are no significant customers at this node.
5. Project Victoria: A Rebuilding Strategy for Electricity in Victoria, Tasman Institute, 1991.
6. Industry Commission, Energy Generation and Distribution Report, No. 11, 1991
7. Exceptions included gas where AGL had a monopoly in NSW and, arguably, BHP steel, the integrated plant of which had been found by the High Court, in the Queensland Wire case, to be required to be opened to competition. (See W. Pengilly)
8. Mergers have reduced the original five host distributors/retailers to three retailers and four distributors. Only one of the retailers retains common ownership with its "host" distribution business.
9. For Vic and NSW. For S.A.
10. These figures refer to small customers, some 95% of which are households. They also include some double counting where customers have changed retailers more than once. An alternative measure is of customers who are no longer with their original retailer. For Vic as at September 2005, this is 32.5% and for NSW 11%; these latter figures exclude customers who have new supply contracts with their original retailer.
11. This has brought a voluminous level of studies. Those in Australia include the skeptical like Mountain, B. and Swier, G. Entrepreneurial interconnectors and transmission planning in Australia, The Electricity Journal, March 2003. London Economics in its work for the ACCC (Review of Australian Transmission Pricing, 1999), also concluded that entrepreneurial links could not cover their fixed costs. This skepticism is also seen in the work of Joskow and Tirole (e.g. Merchant Transmission Investment, CMI Working Paper, 24 The Cambridge-MIT Institute, 2003). The Australian 2002 Paper on Independent Review of Energy Market Directions saw a possible role. Littlechild has been more supportive both in studies in Australia and Argentina (e.g. Littlechild, S. (2004) "Regulated and merchant interconnectors in Australia: SNI and Murraylink revisited." Applied Economics Department and The Cambridge-MIT Institute, Cambridge University, Cambridge Working Papers in Economics CWPE No. 0410 and CMI Working Paper 37; and Stephen C. Littlechild and Carlos J. Skerk Regulation of transmission expansion in Argentina CMI, Working Paper 61, University of Cambridge, Department of Applied Economics, 15 November 2004). Further complications to the issue also result from the flowgate and nodal pricing debate.
12. This tends to confirm a dimension of Hogan's "slippery slope" hypotheses whereby due to its ability to compel payment government ownership tends to drive out private ownership. Hogan W.W., Transmission Market Design
13. Macfarlane I (Minister for Industry, Tourism and Resources) (2003), Applications for Revocation of Coverage of Certain Portions of the Moomba to Sydney Pipeline System: Statement of Reasons.
14. 10 August (2004). Review of the gas access regime, productivity commission, report No. 31.
15. For a discussion on whether the generators exercise market power see, Wood, "Is there market power in Australian electricity generation?" ACCC Regulatory Conference, July 2004. For an analysis of rational bidding strategies see Peter Cramton, Competitive bidding behavior in uniform-price markets. Hawaii International Conference on System Sciences, January 2004.
16. This led to minor modifications to the guidelines on re-bidding volumes close to dispatch. See http://www.aer.gov.au/content/index.phtml/itemId/659216
17. Richard J. Wood. November (2004) Economic and Environmental Potential of Energy Efficiency Regulations: Submission to the Productivity Commission Inquiry into Energy Efficiency
18. See http://www.anl.gov/Special_Reports/NuclEconAug04.pdf
19. Some private generators suggest this price, which is cited as being available from new government generators, is sub-economic price because it incorporates a de facto subsidy as a result of the Queensland government accepting lower levels of return than the private sector would require.
20. Source Uranium Information Centre
21. NSW Government, Energy Directions Green Paper.
No comments:
Post a Comment