Submission to the Garnaut Climate Change Review
SUMMARY
Contrary to many assertions, including those of the Stern report, the costs of reducing emissions of carbon dioxide and other greenhouse gases will be considerable.
Having agreed to meet specific levels of emissions reduction by signing the 1992 Kyoto Convention, many countries have lowered their emission reduction bar by redefining the processes by which emissions might be reduced -- Australia has counted reductions in land clearing as a contribution to its goal. However, almost all countries, like Australia have incurred considerable costs in subsidies to renewables and other measures involving regulating the use of energy and energy using goods. In spite of these measures and notwithstanding that the first level of cuts is likely to be easiest, signatories to the Kyoto convention have failed to meet the obligations they set for themselves.
Far more draconian emission reductions are required than agreed to at Kyoto if the world is to see a reduction in the concentration of carbon dioxide and other gases said to be responsible for global warming. This would require vigorous action by all countries. It would require more intensive measures by developed countries, the only ones with serious abatement commitments under the Kyoto Convention. It would also require the adoption of abatement measures by developing countries, the emissions of which now surpass those of the developed world.
The difficulties recorded by developed countries in abating emissions would be far greater for developing countries. Per capita emissions of developing countries are presently only one quarter of those in developed countries. Absent a technological breakthrough, requiring developing countries to reverse, or even reduce their trend growth in emissions would, if enforceable, consign them to income levels that would remain considerably lower than those of developed countries.
For this reason alone, short of an as yet unheralded technological breakthrough or widespread global adoption of nuclear power allowing a phasing out coal and gas based electricity generation, lower levels of emissions cannot be achieved.
Australia has more to lose than other countries from measures that require abatement of carbon dioxide and other greenhouse gas emissions. This is because we have a comparative advantage in cheap electricity based on our easily won and plentiful supplies of coal. These are basic to the nation's industrial structure. In addition, there appears to be a stronger opposition in this country to nuclear, the only form of electricity supply that is remotely comparable in costs to thermal power.
Australia is also one of the most important world suppliers of coal and natural gas, both of which would come under increasing pressure if general and global abatement measures were to be taken.
It follows that whatever interests the world has in lowering emissions of designated greenhouse gases, Australia has much more to lose than other countries.
1 THE MAGNITUDE OF THE TASK
1.1 THE STERN REPORT
Based on its assumptions of a considerable acceleration of global warming, and some bold conjectures about cost reductions from new technologies in mitigating those effects, the Stern Report sought reductions in global emissions of carbon dioxide by 80 per cent of current levels. Stern argues that the economic cost will be a total of one per cent of world GDP, "which poses little threat to standards of living given that the economic output in the OECD countries is likely to rise by over 200 per cent and in developing countries by more than 400 per cent." (P.239)
This is highly optimistic. The real economic task involved is demonstrated by the modest outcomes of changed energy policies that he cites. Among these is the very minor emission reductions achieved in the EU under its Kyoto commitments. This is in spite of regulations on energy use and subsidies to renewables as well as a carbon use restraint program based on caps and trade. The capped emission trade has a tax equivalent that has ranged between EU 32 and 0.08 per tonne and currently at around EU 20 per tonne of CO2 (enough to increase the Australian wholesale price of electricity by almost two thirds).
Many reviewers of Stern have been highly critical of his findings. The PC (1) addressed some of the report's strengths and weaknesses. The PC noted Stern assumes higher temperature increases as a result of carbon dioxide and other emissions than the IPCC. The PC also noted that the Stern report has no adaptation assumptions, lengthy and spurious suggestions about the cost of health, and in general "draws heavily on studies that have a more pessimistic view on climate change and its impacts and gives little attention to more optimistic views". The PC was also critical of the low discount rate Stern uses (1.4%) which allows it to come to far higher costs than any other study and argued that Stern, "erred in its failure to present a range of results for different discount rates."
The PC sees some merit in the report. It commends it for highlighting the need to address the issue within a cost: benefit framework and in the context of a potentially considerable risk. In this respect, Stern recognises that any CO2 reduction would need to address fossil fuels. It saw a key feature in this being a form of tax. Placing this at an initial level of $US100 per tonne of CO2 -- which would increase Australian wholesale electricity prices one and a half fold -- it sees new technologies cutting in by 2030. At that time its median estimate of the tax becomes around $US35 per tonne.
In addition to these tax effects, the Stern estimates also include other measures like a continuation of existing energy efficiency taxes and programs. They also incorporate a considerable emphasis on energy saving at the production end and voluntary energy saving (partly stimulated by education programs).
1.2 THE INITIAL STEPS TAKEN BY THE DEVELOPED COUNTRIES
Many developed countries, including Australia, have incurred considerable costs in subsidizing and regulating in favour of high cost energy sources with low emissions.
In spite of this, and the fact that the early gains are likely to be the easiest because they tap into the fabled “low hanging fruit”, no major signatory will meet the obligations it agreed to. Although individual European Union countries will meet their targets -- Germany because of unification, and the United Kingdom because of the shift from coal powered electricity generation -- the EU as a whole is presently falling short and this is likely to be amplified in the 2008-12 period over which commitment results are measured.
Australia, which claimed to be only 4.5 per cent above 1990 levels in 2005 will, if the economy continues to grow, be some 14 per cent above 1990 levels for the Kyoto yardstick average of 2008-12. Australia would be over 25 per cent above its (highly generous) Kyoto target of 108 per cent of 1990 levels were it not to include its creative (and unplanned) definition of land clearing among its credits. Norway has also benefited from this inclusion of clearing credits and, as a result, is the only country meeting its target. Canada, often in the vanguard of countries that loudly trumpet their political correctness, is among those falling furthest from the goal to which it agreed.
Table 1 is drawn from the latest United Nations Framework Convention report and indicates levels of achievement compared to the 2008-12 targets expressed as the emissions in excess of or below the1990 base level. The latest data is for 2005 and the levels are expressed on two bases: with and without counting land use changes as a result of policy towards clearing land for cultivation.
Table 1: Levels of achievement of Kyoto Commitments
| 2008-12 target | 2005 actual Inc. clearing | 2005 actual Exc. Clearing | |
| Australia | 8% | 4.5% | 25.6% |
| Canada | -6% | 54.2% | 25.3% |
| EU | -8% | -4% | -1.5% |
| Japan | -6% | 7.1% | 6.9% |
| NZ | 0% | 22.7% | 24.7% |
| Norway | 1% | -23.1% | 8.8% |
| US | -7% | 16.3% | 16.3% |
Source: UNFCC
1.3 THE GLOBAL SETTING OF AN EMMSSIONS REDUCTION SCHEME
Compounding the effect of the difficulties that developed countries have in reducing emission levels are the impossibilities of this being achieved by developing countries. Fast growing developing countries currently have relatively low per capita levels of carbon emissions. However, their economic growth is highly dependent on fossil fuels and this presents seemingly insuperable obstacles to stabilizing world carbon dioxide emissions.
In 2004, global greenhouse gas emissions (in CO2 equivalents) were 28,790 million tonnes. Just over 10 per cent of these were from the former Soviet bloc with the rest split fairly evenly between the Organisation for Economic Co-operation and Development (OECD) countries and the developing world. Emissions from OECD countries grew at 1.3 per cent per annum 1990-2004. Those of the developing countries saw annual growth at 5.7 per cent. The former Soviet bloc's emissions fell by 1.7 per cent per annum.
In 2008, developing countries' emissions will exceed those of the OECD countries. This will increasingly dilute any actions taken by the developed OECD nations, the only group seriously considering abatement measures. The dilution is further amplified if abatement in the OECD is achieved by smelting and other energy intensive activities being re-located to developing countries.
Table 2 illustrates recent emission levels and trends.
Table 2: CO2 Equivalent Emmissions (million tonnes)
| 1990 | 2004 | Annual increase | |
| OECD | 11,205 | 13,319 | 1.3% |
| Former Soviet Bloc | 4,182 | 3,168 | -1.7% |
| Developing Countries | 6,833 | 12,303 | 5.7% |
| Total | 22,220 | 28,790 | 2.1% |
In spite of the rapid growth in developing country emissions, their per capita emissions remain considerably below those of the OECD countries. In 2004, OECD emissions averaged 11.5 tonnes (the US and Canada were at 20 with Australia at 16.2 tonnes). Per capita emissions in developing countries averaged 2.4 tonnes.
There have been suggestions that the developing countries should be brought into an emission reduction scheme by granting them tradable emission rights. This offers superficial attractions of all round wins. Developing countries would be given rights that would be surplus to their requirements, rather like the earlier case when post-communist countries in the former Soviet bloc were brought within the system. Those countries' adoption of capitalist production and pricing methods encouraged conservation of resources and meant their previous emission levels were far higher than their reformed economies later required. Granting them their existing levels of emissions and allowing them to trade the surplus amounts handed them windfall gains.
The treatment of the former Soviet bloc countries in this way was crucial to getting their agreement to the Kyoto Convention and in turn to the Convention receiving the global support necessary for it to come into force as an international treaty. But at the same time this vastly expanded the quantities of permitted emissions, by activating "sleeper" emission rights. In this way it somewhat undermined the basic intent of the protocol. The far greater magnitude of developing country emissions, their less wasteful use of energy and their future need for much higher levels of energy use makes it impossible to adopt a similar approach.
With the constraints on the Kyoto approach it is arithmetically infeasible to bring in developing countries to achieve stabilisation at 2004 levels of 28,790 million tonnes under any practicable or fair apportionment of the emission levels. It follows that any consideration of rolling back global emission levels is ludicrous.
This is readily illustrated. If OECD countries were to reduce their emission levels by 20 per cent -- the minimum that was floated at the Bali Conference -- and the former Soviet bloc were to hold their emissions constant, then to achieve stabilization in 2030 would require developing countries to limit their increases in emissions by 22 per cent as illustrated in Table 3.
Table 3: Emission Stabilisation Scenario (million tonnes of CO2 equivalent)
| 2004 | 2030 | |
| OECD | 13,319 | 10,655 |
| Former Soviet Bloc | 3,168 | 3,168 |
| Developing Countries | 12,303 | 14,967 |
| Total | 28,790 | 28,790 |
While superficially generous to the developing countries the 22 per cent increase is a massive reduction compared with business-as-usual levels. Compared with the 15 billion tonnes of carbon dioxide equivalent projected under this scenario, business-as-usual levels - based on previous growth rates - would see developing countries emitting over 23 billion tonnes in 2030. Moreover, because of their population growth, limiting developing countries' emission levels to 15 billion tonnes of carbon dioxide equivalent would result in their emissions per head actually falling, from 2.4 tonnes to 2 tonnes. A 2 tonne average is less than one fifth of the OECD 2004 per capita average of 11.5 tonnes and only a quarter of the OECD average in 2030 (7.9 tonnes) once a 20 per cent reduction and population growth is incorporated
Under the mix of current technologies, stabilization of emissions cannot be achieved unless developing countries were forced to follow a similar emission reduction path to OECD Countries (leaving their per capita emission levels at one quarter of those of the OECD). If, for example, developing countries were to maintain their 1990-2004 levels of increase and the former Soviet bloc's emission levels remained constant, this would leave virtually no emissions for the OECD group in 2030! Even under that scenario the developing countries' 2030 per capita emissions would be less than one third the current OECD level.
EU Commission President Barrosi (2) has indicated that the EU will consider trade sanctions against imports that are advantaged by energy costs unencumbered by emission allowances. Although Mr Barrosi added a rider, "as long as such a system is compatible with WTO requirements", were such a policy to be pursued, it would bring an unravelling of the international trading system that has developed over the past 60 years.
Barring some presently unforeseen technology breakthroughs, if developing countries were somehow forced to hold their emissions at their present levels, they would be unable to close the gap with the developed world's living standards. There is, of course, the prospect of new technologies emerging. Draconian cuts in emission levels would require taxes or prices on emission levels that would certainly stimulate the discovery of these as well as energy use economies. But the necessary technological breakthroughs have, as yet, barely been imagined.
A wholesale replacement of coal and gas by nuclear for electricity generation would also be capable of achieving the required reductions -- at least over the next forty years. However, those pressing most strongly for emission reductions are also strongly opposed to nuclear power.
2 EXISTING AUSTRALIAN MEASURES
2.1 TAXES, REGULATIONS AND THE CREATION OF TRADEABLE RIGHTS
All regulations, taxes ceilings on production and requirements on producers are related in their effects. In fact, regulations have effects that are almost indistinguishable from taxes and can be usually expressed as a tax.
The two do however have very different wealth distribution effects, at least during a (sometimes relatively long) transition period. Hence industry people with current emissions favour cap and trade. From their own perspective this would protect them from a form of retrospective taxation; others would see it as delivering a windfall gain. Many in government and the community favour a tax. Many of those in government who speak in favour of a cap and trade often support such a system having a significant and growing component created by auctioning the rights. This can be closer to a tax than the classical cap and trade where rights are accorded freely in recognition that their owners had de facto rights prior to ownership being formally vested.
Environmental activists often favour the economic inefficiency of command and control regulations, since they are indifferent to costs and consider lower levels of consumption as a per se goal.
2.2 CURRENT AUSTRALIAN PROVISIONS
In effect, there is already a plethora of carbon taxes and their equivalents in place in Australia. These fall within three categories.
2.2.1 Electricity inputs
- The Commonwealth's Mandatory Renewable Energy Target (MRET), which by 2010 requires 9,500 GWh of exotic green electricity (around 4.5 per cent of supply) with a fall back cost of $380 million from the $40 per MWh penalty.
- Queensland has a 13 per cent gas requirement applies to a load of about 40 million GWh by 2010 (9 million is exempt and load losses are assumed at 8 per cent). The penalty for shortfall is $15 per GWh (not tax deductable) indexed at the CPI. By 2010 the scheme is estimated to cost $97 million. In June 2007 the Queensland Government launched a, "$414 million climate change strategy ClimateSmart 2050", though it is not clear what additional funding this will entail.
- Victoria requires 10 per cent renewables or 3672 GWh per annum when it hits maturity (around 2015). The CPI indexed penalty rate is $43 means a cost of $184 million.
- NSW has a scheme that is actually targeted at green house emission levels. NSW retailers by 2011 are required to buy credits to offset 13.6 million tonnes of CO2 (over and above MRET obligations) with a penalty of $13.36 per tonne. This is a cost of $182 million but the availability of eligible credits means the cost is currently costing half of this.
These four schemes amount to an annualised cost of $843 million. Currently MRET emission credits are selling at a 25 per cent discount to the penalty rate. Applying this to the other schemes reduces the costs to $600 million.
2.2.2 Direct subsidies
There is a further $499 million identified by the Department of Environment (DoE) in programs which it classifies as directed at climate change. This expenditure is likely to be understated as it has grown very rapidly in previous years. It includes major programs like Emissions Management ($70 million plus), Renewable Remote Power ($50 million plus) and Low Emission Technology ($70 million plus).
In addition other expenditure on other projects is at least partly justified by greenhouse concerns. Included in this would be the increased spending on the Great Barrier Reef, on "ecologically sustainable" fishing, environment research Green buildings, "Sustainable cities" and local government grants. Added to this was the $8000 subsidy for photovoltaics announced in this year's budget with the price of $150 million for the economy that is understated in the DoE estimates.
The states too have schemes (Victoria for example claims to be spending $106 million over five years).
Overall, subsidies are estimated to amount to over $900 million a year.
2.2.3 Regulatory Impositions
Governments have a range of measures that add costs to reduce energy and greenhouse emissions. The most important of these are 5 Star measures on housing which add between $7000 and $14,000 to the price of a new house and in aggregate annually cost $1-2 billion.
Also included are the energy efficiency standards on fridges and a host of other appliances. And the AGO has a series of similar regulations ready to be introduced on picture screens and other energy using purchases. These follow reviews that point to the "market failure" alleged to follow because consumers are said to be unaware of the complexity of the products and to overlook the energy usage they entail in favour of other features. It might equally apply to most products and perhaps we should substitute the wisdom of government for consumer choice more generally!
Aside from requiring a regulation to force people off the cheaper appliances, the effect may be less than its proponents hope. This is because many of the goods the lower carbon emitting products are intended to replace are actually retained and converted into a spare beer fridge for example. Minimum Energy Performance Standards (MEPS) targets products that account for only 2 per cent of Australia's total greenhouse gas emissions. The measures, once having reached maturity are estimated to reduce emissions by less than 0.2 per cent of the business-as-usual levels.
These measures considerably reduce consumer choice. According to the PC "The regulation impact assessment for Australia's future air conditioner MEPS estimated that among the models registered in August 2004:
- 92 per cent would not comply with an alternative MEPS based on the next best European benchmarks; and
- 96 per cent would fail the MEPS scheduled for 2007." (3)
The PC did not estimate the tax effect of these and similar regulations, which are summarised in Table 4.
Table 4: Summary of Budgetary and Regulatory Expenditures
| Measure | Cost ($M) |
| 1. Electricity | |
| i) MRET | 380 |
| ii) Queensland gas and ClimateSmart 2050 | ~ 120 |
| iii) Victorian renewables | 180 |
| iv) NSW NGAC | ~ 182 |
| Total | ~ 860 |
| 2. Direct subsidies | |
| i) DoE identified | 499 |
| ii) Other Commonwealth | ~ 300 |
| iii) State schemes | ~ 100 |
| Total | ~ 900 |
| 3. Regulatory impositions | |
| i) Five Star building regulations | 1000-2000 |
| ii) Minimum energy performance requirements | |
| Total | > 1000-2000 |
| Total of all measures | > ~ 2760-3760 |
Many prescriptions for reducing carbon dioxide emissions entail the creation of a more peaky load. Recent calls (when in Opposition) by the Environment Minister Mr Garrett to ban electric hot water systems as well as the measures favouring renewables by the Commonwealth and Victorian governments bring a peakier demand and supply profile and therefore higher costs.
Subsidies to solar and other renewables are aggravated by State government policies paying a "fair" (read excessive) price for feeding renewables back into the grid. This means that households with solar panels are being subsidised to provide electricity when they don't need it themselves (and when it is not very valuable).
Such measures impose costs on the system not only by creating a bias in the generation mix in favour of high cost sources but also in increasing the average costs of supply by creating higher peaks and lower troughs thereby increasing the need for distribution and transmission capacity. This is exacerbated even further when the energy is derived from dispersed and sometimes remote sources and the costs of its connection to the grid are smeared.
More difficult to quantify are the costs stemming from requirements based on planning and government stimulated or fomented opposition. One such important event was the Hazelwood expansion which transformed a straight-forward planning application into a review of Kyoto. Similarly, NSW Government financed green activists successfully opposed the building of the Redbank 2 coal fired generator in spite of that government having made commitments to it.
2.3 THE CARBON TAX EQUIVALENT OF CURRENT AUSTRALIAN MEASURES
The expenditure outlined above comes to about $3000 million per year. Allocated as a tax on stationary sources (280 Megatonnes) this works out at $10 per tonne of CO2 or on all emissions $5 per tonne.
It was not so long ago that some proponents argued that this range was sufficient to bring about the abatement they considered necessary. For example, the Allen consultancy report of the Kyoto Ratification Advisory Group, for the Premiers of NSW, Victoria and SA used price estimates ranging from US$3.75 (with international permit trading) to $7.50 per tonne of CO2 (without international permit trading). There were also some other taxes and measures on top of this but these were left unquantified.
It is now clear that a far higher tax than this is required to force the required lower emissions. Tim Flannery has recently suggested that $70 per tonne would be all that is required. The Stern number of US$100 also incorporates considerable assistance through persuasion and education to assist in defraying emissions -- calling upon what the economist Lionel Robbins famously referred to as "that very scarce commodity, human love".
2.4 EFFECTS OF AN ADDITIONAL CARBON TAX OR TRADEABLE RIGHT
2.4.1 Current projections of low carbon ectricity output
The ALP nationally and in some states has a target of reducing emission levels by 60 per cent by 2060.
Such targets are not achievable without somehow abolishing coal as a primary energy source or at least putting in scrubbers or sequestration programs, the cost of which are currently far in excess of the cost of coal derived electricity.
Present estimates indicate that ten years from now, in spite of the budgetary and regulatory treasure poured into the various schemes, little more than 10 per cent of energy will be renewable. Chart 1 illustrates trends on current policy settings, with the exotic sources (those like wind and solar panels that require a subsidy to be viable) comprising a little over half the total.
Chart 1: Renewable energy share of electricity supply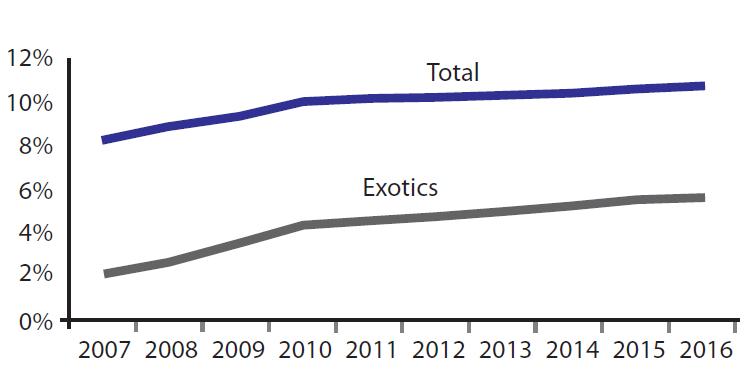
It is generally agreed that any meaningful emission reduction must have, at its centre, reducing electricity production from fossil sources. The differing energy to carbon properties of the various inputs allows us to model different plant costs alongside the level of tax.
Without carbon penalties, for new generation super critical Australian coal plants, electricity can be produced at a price of $35-40 per MWh. Gas might be $45, wind perhaps $80 and solar hot water and photovoltaics $100 and $400 respectively.
Once a carbon price is added the economics change markedly. At a tax of $40 per tonne gas becomes the cheapest option. However the Australian gas price is extraordinarily low. It would have to more than double to be equivalent to world prices and at that price coal remains the lowest cost option.
At a tax of $125 per tonne of CO2 gas more convincingly surpasses coal. Both solar water heaters and wind are even more competitive, but these two technologies can only ever comprise a small part of electricity generation because of their irregular nature. Some suggest a level of 10 per cent is possible but that would also require some costs in augmentation of the grid and back up power.
Chart 2 shows how the different fuel economics might pan out with taxes on CO2 levied at $40 and the Stern level of $125 per tonne.
Chart 2: Economics of Differing Fuel Sources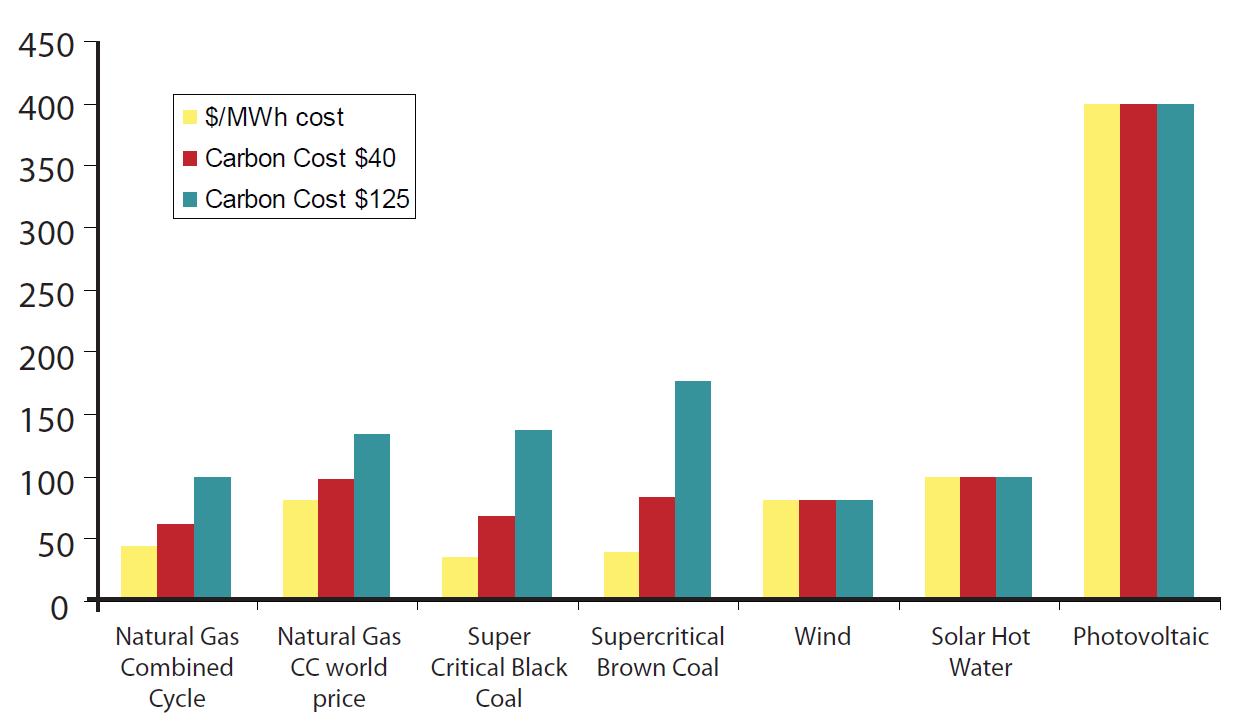 Source: Data from SKM
These relative costs are based on an absence of technology to allow low carbon emitting coal use. Known but unproven technologies may make this possible at the $125 per tonne carbon cost. Some have suggested a cost of scrubbing and sequestration of $80 per tonne though this remains theoretical and in addition, there is an added cost of the coal itself 30 per cent of which represents the wasted component of the fuel that is carbon as opposed to hydrogen.
It should also be bone in mind that even if gas replaces coal completely, because of its emission levels this would still not allow a 60 per cent reduction in emissions even with no growth.
Using the Monash Multi-Regional Forecasting (MMRF) Green, the Allen Consultancy's work for the Business Roundtable on Climate Change (4), estimated that for a 60 per cent reduction in emissions to 2050, real GDP's average annual increase of 2.2 per cent under the business-as-usual projection falls to 2.1 per cent a year if "early action" is taken to reduce emissions. This means income foregone of $2.0 trillion in 2050, or around 6 per cent less than in the base case. A carbon tax of $100 per tonne was assumed.
Although many things can happen over a 45 year time horizon like that modelled, in view of the dramatic structural change and loss of comparative advantage the necessary abandonment of carbon based electricity would entail, these forecasts seem highly improbable.
2.4.2 Nuclear power
The foregoing is based on a no nuclear option.
Once we introduce nuclear as a possibility, we can replace most fossil fuel power stations (leaving some fast gas and hydro to even-out the peaks). This could be done at a tax equivalent of only $25 per tonne of CO2. In principle, a country the size of Australia would have no difficulty finding sites for the 16 nuclear power stations needed to replace existing coal fired stations and the dozen or so more for expansion.
With nuclear being progressively phased in to replace coal plants an ex-plant price premium would be required, based on current cost estimates, of about 25 per cent. This would translate into a cost impost to the average household of about 10 per cent and to major industry users about 15 per cent.
For Australia, even such price increases would mean the progressive disappearance of most smelting activities and a general lift in costs. For the nation as a whole they would also entail the devaluation of coal resources, especially the low quality coal used as fuel for domestic electricity generation. Aside from the costs of the power station conversions this would entail a wealth loss to the nation of several hundred billion dollars. It might be likened to, for example excising South Australia and ensuring it is made totally unproductive.
Moreover, Australia has no advantage in nuclear, indeed we have a lead weight in our strong anti nuclear pressure groups. Our advantage is in cheap fossil fuel based energy. Australia has perhaps the cheapest primary energy in the world available in major quantities. Coal from Queensland and parts of NSW is abundantly available for conversion into electricity at $40 per MWh virtually forever. Brown coal in Victoria is available at a similar price.
These prices are less than a half of those in Japan and considerably below those of the EU and most of the US. But though Australian energy prices remain low, the gradual introduction of emission reduction policies is seriously reducing this advantage over other countries.
2.4.3 Offsetting carbon emissions
Both with Australia-only trading and with a global trading program, offsets are a significant element in policy proposals. We have a great deal of tree planting underway at present. But tree planting takes 100 years to fully offset the emissions (the life of the tree) and if the issue is as pressing as the green radicals maintain this would be too long.
Other issues are the security of the offsets (something that is common to forests, carbon burial grounds and offsets in some overseas countries).
3 POLICY CONCLUSIONS
3.1 MEETING EMISSION REDUCTION GOALS
Greenhouse averting measures of a taxation and regulatory nature have already entailed a considerable cost to consumers. Some of the measures are disguised but they are no less real.
The present cost of subsidies and regulations are at least $3000 million per year, which if levied on major emission sources would equal to $10 per tonne of CO2, and coincidentally around $10 per MWh for electricity.
If we are to meet some of the goals advocated by politicians, then these costs will pale into insignificance.
Without nuclear or some technology breakthrough that is not yet even been considered, achieving any of the possible permutations of a 60 per cent reduction is inconceivable. It would require the main effort to be made not through substitution of low or zero emitting carbon emitting power plant but by pricing action to reduce electricity usage. In per capita terms the reduction would need to amount to about half of its present levels -- more than this if it was also hoped to co-exist with some form of real economic growth.
There are West European countries which manage with per capita emission levels at a half of Australia's but, partly as a consequence of their high energy prices, they do not have the industrial structure of Australia (smelting alone accounts for 25 per cent of electricity usage in Australia).
In that sense other developed countries outsource many of their carbon emitting production processes. This serves to illustrate that Australia's industrial profile, given the lower carbon emissions required would not only mean a reduction in living standards but would have little effect on global emissions since the industries would migrate offshore.
Using comparative country analyses can be misleading -- some countries import their electricity in energy intensive goods while others like Australia export energy incorporated in such goods.
The measures that Australia has already taken are likely to have an impact on industry structure. This impact is also likely to occur with aluminium smelters. Given the risks of taxes, it is difficult to envisage additional smelters being built in Australia even if the industry received assurances that it would be somehow insulated from higher greenhouse abating taxes.
Such changes would be vastly amplified by major additional energy cost impositions. Still further vulnerabilities are evident with export industries. In addition to having developed an industrial profile to take advantage of cheap domestic supplies of carbon-based energy, one quarter of Australian exports directly involve coal, gas and other carbon based products.
3.2 POLICY APPROACH
If measures are to be taken to reduce emissions, a tax or tradeable rights regime linked to a progressively larger auction component is likely to be the best route. Commandand-control regulations like banning certain products and setting standards are always likely to be inferior. A long literature into regulatory measures has demonstrated the deficiencies of such approaches as well as the inferiority of government winner-picking (for example subsidising solar generators). But such measures are merely of the nature of "least worst".
Measures agreed to on a global scale that sought to defray emissions would impact more on Australia than perhaps any other country in the world. Australia's international trade and domestic industries are geared to energy prices that are among the lowest in the world. It would be remarkable, perhaps unprecedented, for a country to be in the forefront in adopting measures that disadvantaged itself more than any other nation.
Ironically, Australia would probably make its best contribution to restraining global emission restraints, given that these are necessary, by policies that entail expanding its own emissions. Higher emissions in Australia caused by relocation of energy intensive industries to this country would be likely to bring about reduced global emissions. This is because Australia's energy production and use is efficient and because in some cases the policy outcome would avoid costs and emission involved in transporting coal.
Political leaders have already acknowledged a wish to avoid damaging tradeable activities that are energy intensive. Smelters have been singled out for attention as an industry sector to be shielded from cost enhancing greenhouse gas mitigation policies. The problem with such industry selective measures is their selectiveness. Other industries rely on cheap energy if to a lesser degree and cheap energy incorporated in multitudinous inputs contributes to competitiveness across the board.
Moreover, cost penalties on the energy component of Australian produced goods are likely to mean their import from overseas suppliers, many of whom would have a larger carbon footprint. This would be augmented once transport is factored-in. Development of a comprehensive global system of carbon credits could ensure that such distortions are avoided but this is not presently feasible.
If measures involving constraints on carbon dioxide emissions are to be adopted, it follows that these should be confined to areas of final consumption of energy products. For this to work effectively a form of tax or allowance would need to be devised alongside credits to uses that are part of the value-added component of production.
ENDNOTES
1. The Stern Review: as assessment of its methodology, Staff Working Paper, Productivity Commission, January 2008
2. See Australian Financial Review 29 January 2008, "EU risks a trade war over climate", by John Breusch.
3. Productivity Comission, Energy Efficiency p.190
4. Allen Consultancy, Report to the Business Roundtable on Climate Change March 2006
No comments:
Post a Comment