EXECUTIVE SUMMARY
The state of our schools is one of the hot policy issues -- not just for Western Australia, but right around the developed world. Policy makers now have a deeper awareness of the importance of good schools in underpinning economic prosperity.
Western Australian schools enjoy a relatively high level of public funding support. On the other hand, WA has higher cost pressures related to a relatively large proportion of indigenous and/or remote area students.
The proportion of WA youngsters completing their education through to year 12 had risen to close to the national level -- but the mining boom has driven a recent decline.
Western Australian students are amongst Australia's -- and the developed world's -- top performers in science, reading and maths.
In terms of student performance compared to public dollars spent, WA school system gets good value for money by comparison with the rest of Australia and the developed world.
Australia's institutions play an important part in ensuring that Western Australians remain near the top of the class.
- Competition between state education systems is healthy
- Competition between government and non-government school systems is healthy
- Competition between schools is healthy
- Competition between teachers to succeed at their careers is healthy
Of all the things that influence student outcomes and that we can do something about, the quality of teaching is the most important. If we have to make a choice between improving student outcomes and keeping teachers happy -- it shouldn't be controversial to state that students must come first.
School policies play a part in facilitating the shift of Australians from the east to help sustain the resource-driven Western Australian economic boom.
- WA teacher salaries need to be -- and are -- attractive by national standards.
- WA should support moves towards harmonising teacher registration across Australia. This will make it easier for WA to transfer teachers from the eastern states.
- WA support for other national standards -- such as a national common school starting age -- would also help other Australians to make the shift to WA.
- Thanks to the boom, it is easier to get a job in WA, including for teenage Western Australians. There is a risk that WA teenagers may be tempted by the immediate cash benefits of a lower skilled job at the risk of dropping out of schooling. The increase in the minimum age for leaving school in WA to 17 years in 2008 could be timely.
Finally, Western Australia should be careful about any proposals which have the effect of transferring policy decisions to Canberra.
INTRODUCTION
The state of our schools is one of our hottest policy issues -- not just for Western Australia but right around the developed world.
The reasons why can be found in analysis that began in the 1990s at the rich world's think tank: the Organisation for Economic Cooperation and Development (OECD). The OECD set out to identify the ultimate drivers of economic growth (1) and, thanks to careful analysis of a new database, schools were found to be much more important for economic growth than previously thought. Each extra year of schooling was found to boost GDP by about 6 per cent. (2) More recently, researchers at the Australian National University have used the data revealed by "natural experiments" (such as WA's decision to lift its school leaving age to 15 years in 1966) to estimate the return on education at a significant 10 per cent. (3)
Higher levels of schooling boost economic activity in two ways. First, higher levels of education are strongly linked to higher levels of worker productivity (and higher wages). Second, higher levels of education are linked to higher levels of workforce participation (especially in older workers nearing retirement age). Of course, high levels of schooling are not for everyone -- better trades skills are also an important education priority. In 2007, work began in WA on cutting "red tape" and streamlining processes for apprenticeships and traineeships. (4)
The Australian government's Intergenerational Report (first published in 2002) confronted the problems of an ageing population. (5) The Australian Treasury promoted a policy outlook for the Australian economy which focussed on the "three Ps" of productivity, participation and population.
In 2006, the Victorian government succeeded in convincing other Australian governments to adopt a "third wave" (6) of national reforms which "would be based on an overarching theme of enhancing productivity and participation, with human capital as a key component". (7) With the recent election of the Rudd government and its commitment to an "education revolution", those third wave education reforms are likely to be reinvigorated, after having largely stalled in the run-up to the federal election.
The focus of the national education reforms has been early childhood education, lifelong learning, youth moving from school into the workforce and student achievement in literacy and numeracy. In the face of such a large national agenda, the focus of this paper is mainly on schools and student achievement.
Schools are one of the "big ticket" items for governments. About $3.6 billion was spent by all levels of government on WA schools in 2005-06. (8) About four-fifths of this was provided by the WA government (in line with the states' constitutional responsibility for schooling). Education and training amounted to just over a quarter of the WA state budget in 2006-07 (9) -- bigger than the health budget.
With so much of our economic potential and public funding dollars at stake, this raises some big questions. How good is the Western Australian school system? Does Western Australia get good value for money from public funding of its schools? Can Western Australia do better? But first we will briefly review public resourcing of Western Australia's schools.
PUBLIC RESOURCING OF WESTERN AUSTRALIA'S SCHOOLS
In 2005-06, total spending per WA government school student (10) was significantly higher than for the other states. Indeed, WA's spending was only outmatched by the territories -- see Figure 1. (The average for Australia is also shown.)
Figure 1: WA school spending per student is highest of the states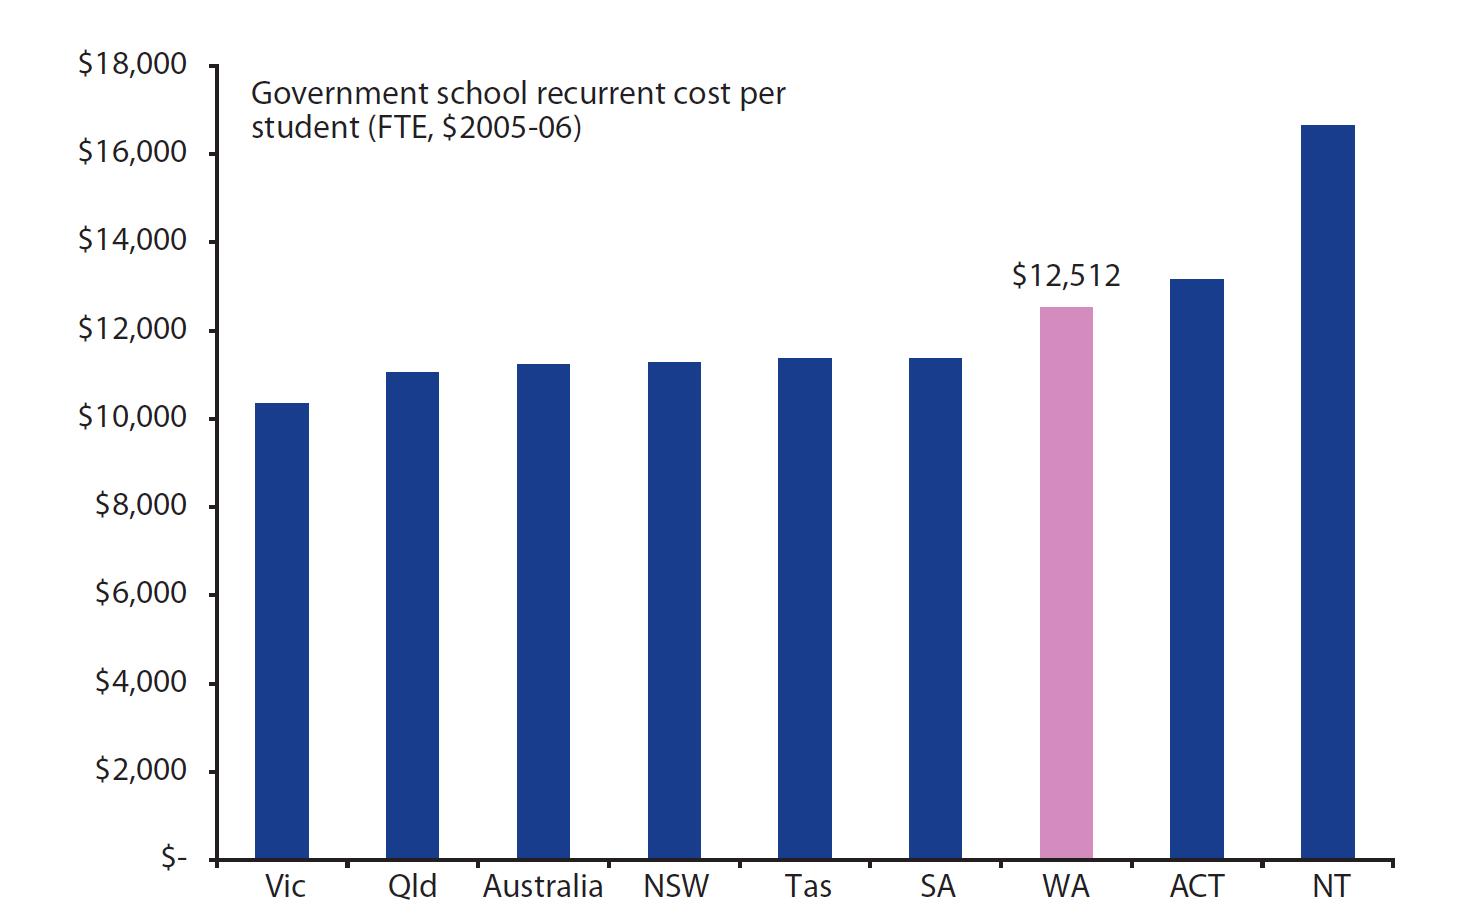 Source: RoGS (2008) Table 4A.8
Of course spending is only part of the story -- each state and territory faces different cost "disabilities" related to the mix of students and geography and the spread of their population. These cost disabilities are largely outside the control of government.
In terms of student mix, some of the major drivers of school costs include the proportion of students who:
- have a language background other than English;
- are indigenous;
- have a disability; or
- live in a remote or very remote area
Figure 2 shows the proportion of students who fit into these categories in WA's schools (both government and non-government) compared with Australian schools as a whole. (There will be some students who "overlap" by falling into two or more of these categories.)
Figure 2: WA vs Australia by selected measures of student disadvantage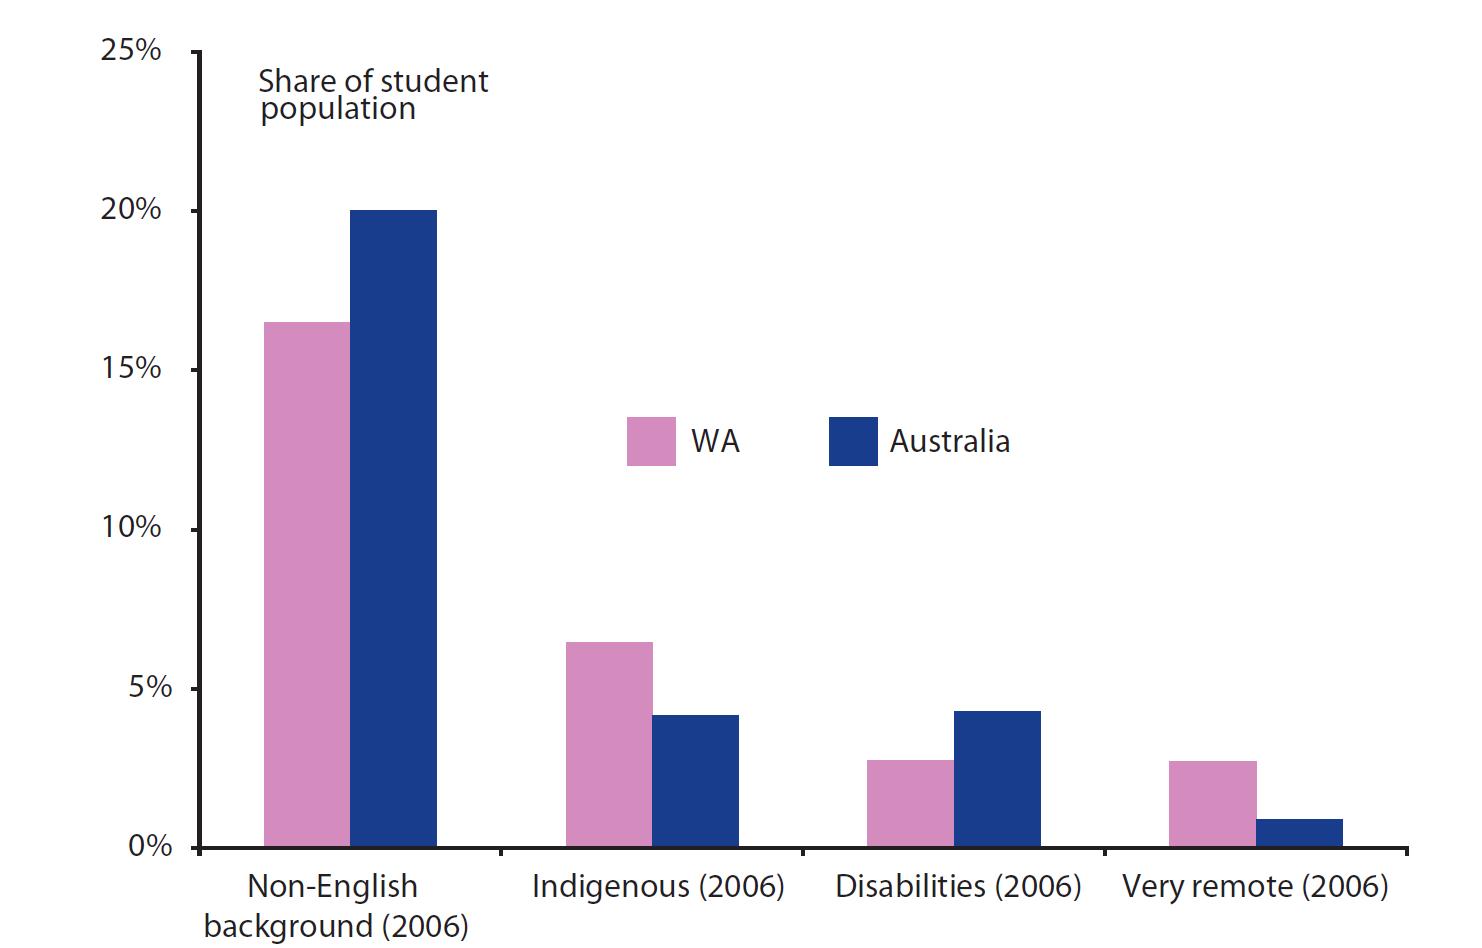 Source: RoGS (2008) Tables 4A.19, 4A.20, 4A.21, 4A. (25)
Non-English speaking background students face a greater risk of not achieving at school because of the potential for a "language barrier" to operate as a block to their learning. There are various programmes for reducing this risk and (as we will see) Australia has been notably successful in integrating these students. The non-English speaking background student population is heavily concentrated in NSW and Victoria. As WA has a significantly smaller proportion of non-English speaking background students (17 per cent) than Australia as a whole (20 per cent), this is a cost factor operating in Western Australia's favour.
Indigenous educational disadvantage is a continuing problem in search of a solution. The proportion of indigenous students in WA is significantly higher than for Australia as a whole, although WA is well behind the NT and just behind Tasmania.
Certain types of disability require specially trained teachers and methods. The proportion of disabled students was relatively low in WA in 2006. (11) However, this may reflect tighter criteria in WA for accessing special education services and programs. (12)
Another form of educational disadvantage that can entail greater costs for the running of the school system is the fraction of children with a family background of low "socioeconomic status" (or SES). SES is usually defined by a mix of parents' income, occupational status and education status. Children from families on low incomes where the breadwinners have little education and low status (or no) jobs are at risk of underachieving. WA's average SES is unlikely to be much different from Australia's.
Finally, students living in non-Metropolitan areas, particularly remote areas, can be much more costly to school because of the difficulties in attracting teachers to these areas as well as the difficulties in maintaining a viable school or class size. (13) Here, WA is at a particular disadvantage as its "remote" or "very remote" student share is about three times larger than Australia's share. (14)
In addition to student mix, another important driver of school public funding costs is the size of the non-government school sector. The average non-government school student attracts significantly less public funding than the average government school student.
In effect, the first $5,600 or so of WA non-government school fees merely serves to offset the reduced taxpayer support for non-government schools. (15)
Most of the recent growth in Western Australian student numbers has been in non-government schools which have added an extra 11,000 students to their rolls from 2002 to 2006.
By contrast, WA's government school rolls have declined by 4,000 over the same period (with a small bounce back in 2006) -- see Figure 3.
Figure 3: WA non-government schools student growth dominates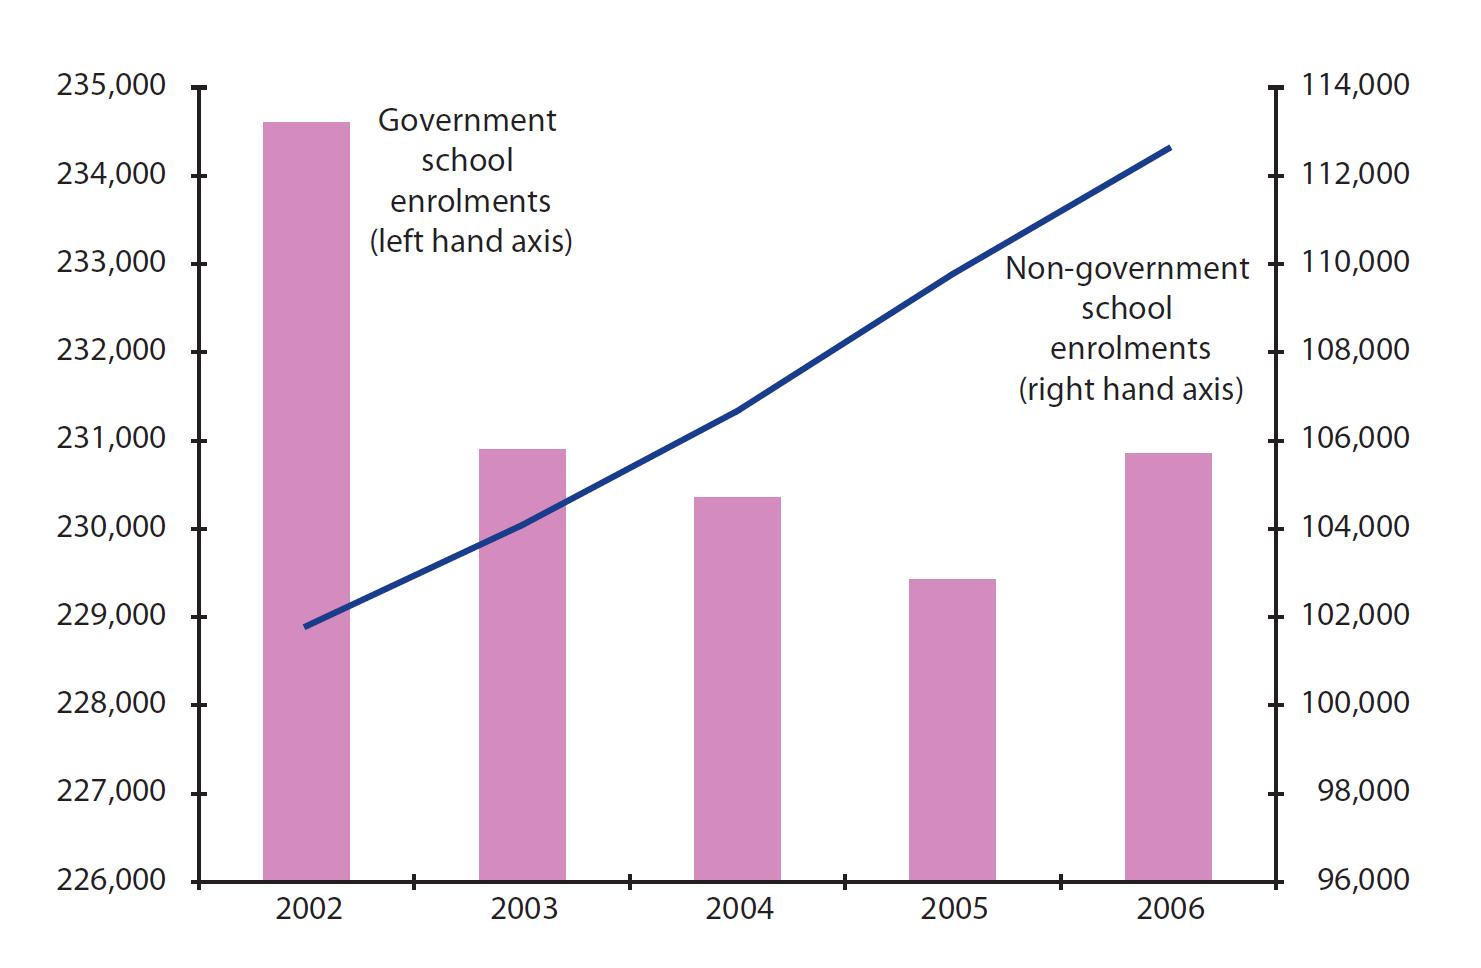 Source: RoGS (2008)Table 4A.1,4A.2
Despite these recent trends, as of 2006, the proportion of government school students in WA (67.2 per cent) was a little higher than for Australia as a whole (66.8 per cent).
The strong growth in Western Australia's non-government school student numbers has reduced pressure on taxpayers to provide public schooling in WA. It is estimated that the total savings to taxpayers resulting from the private financing of the WA non-government school system is in excess of $600 million each year. (16)
The trends in Western Australia's changing government/non-government school student mix amplify national trends.
From 2002 to 2006, WA government school student numbers have been declining more quickly than for Australia as a whole. WA non-government school student numbers have been growing more quickly -- See Figure 4.
Figure 4: WA student growth amplifies national trends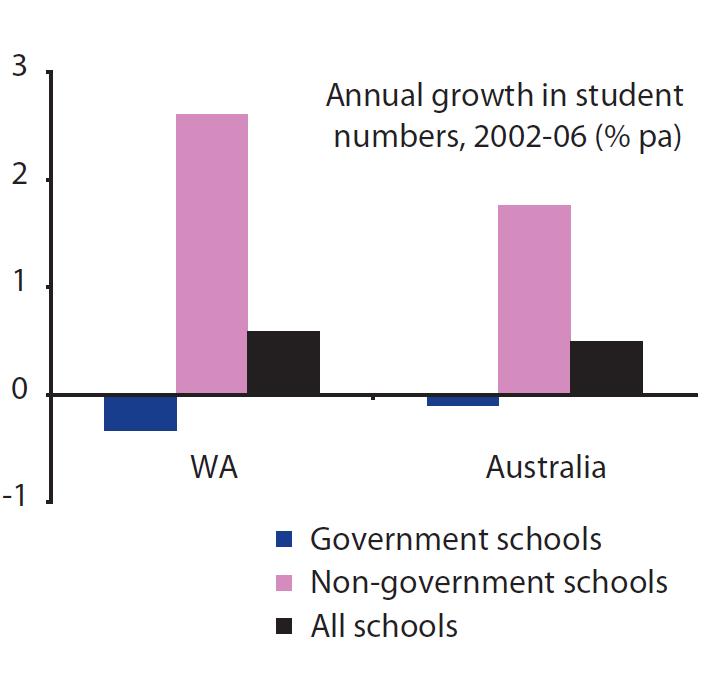 Source: RoGS (2008)Table 4A.18
TEACHING RESOURCES
An important "bottom line" indicator of the relative availability of teaching resources is the number of students for each school staff member. (17)
With trends in WA non-government school numbers catching up with the rest of Australia, this has helped a little in reducing the number of staff per student in the Western Australian government school sector.
In 2006, the number of students for each staffer in Western Australia was well below the national average and one of the lowest in Australia -- see Figure 5. While there are numerous caveats to this data, (18) it seems that staff at WA's schools have increased since 2002.
Figure 5: Fewer students for each staff member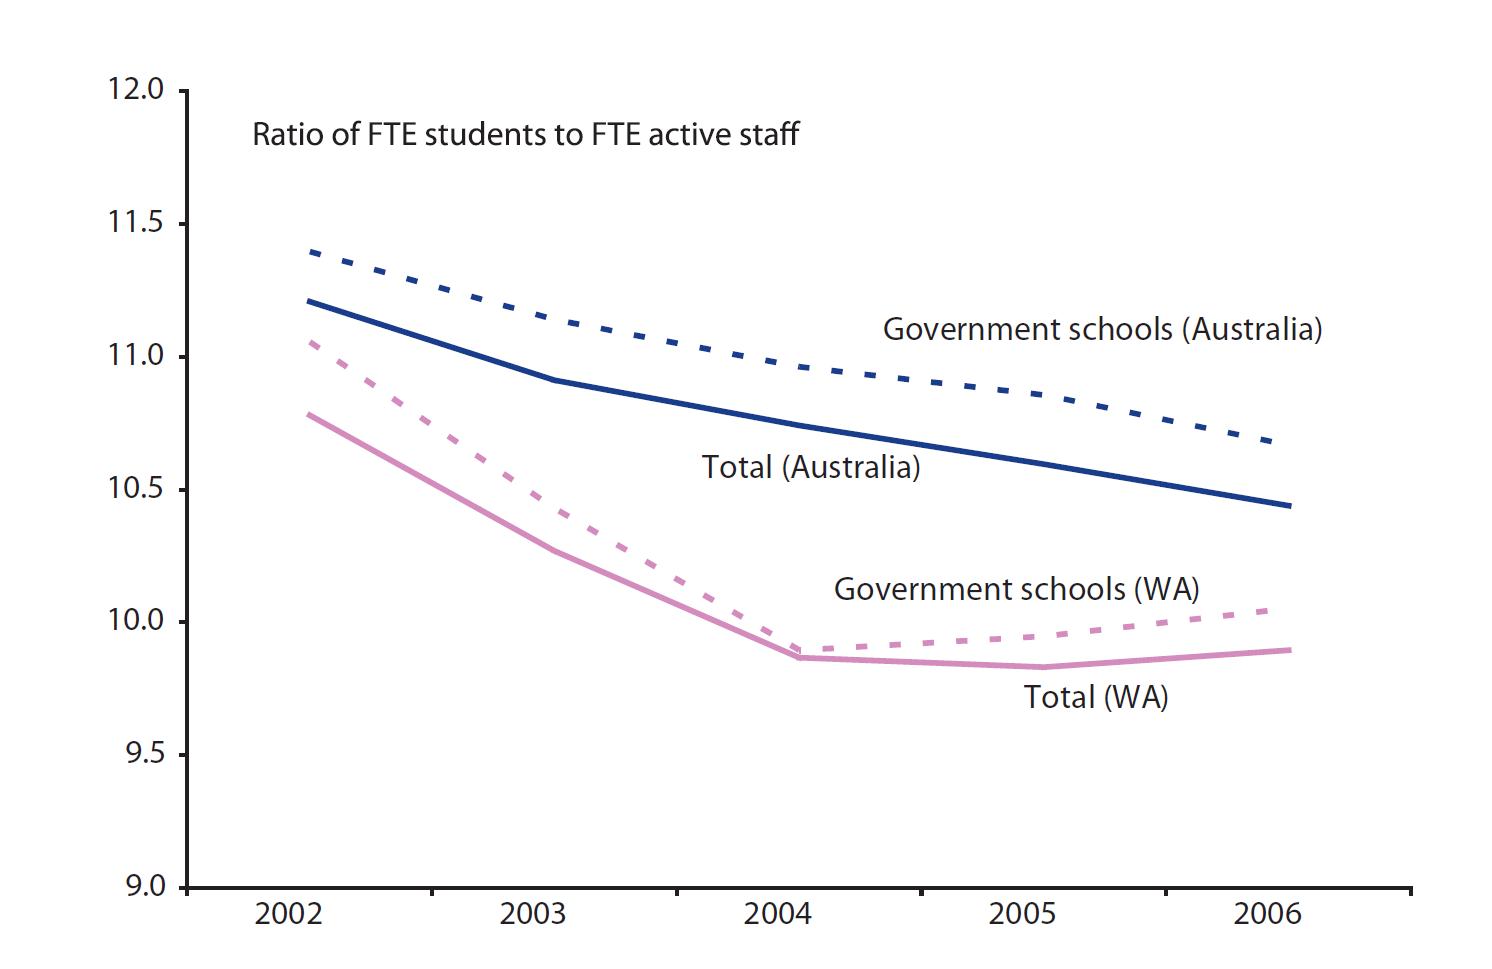 Source: RoGS (2008)Table 4A.1, Table 4A.2, Matthew Ryan
As staff costs (teaching and non-teaching) account for nearly two-thirds of both WA and Australian school costs, (19) WA schools appear to be well-resourced at the "pointy end" of service delivery to educate its 340,000 plus students. (20)
WA STUDENT OUTCOMES
Successful student outcomes, as measured by the quantity and quality of schooling, are of prime interest to policy makers as important drivers of future economic prosperity.
This section will review Western Australia's student "completion rates" and student achievement in literacy, mathematics and science.
COMPLETION RATES
The "completion rate" is the number of students who obtain a year 12 certificate as a proportion of the relevant age group. (21) The completion rate is an important indicator of the success of governments in developing the talents of young people through schooling. (Other measures are being considered for those students who enrol in school part time or pursue their senior secondary studies or an equivalent VET qualification at TAFE.)
In 2006, WA's overall completion rate was 3 percentage points short of the national average (22) -- the left most bars in Figure 6. WA ranked ahead of Tasmania and the Northern Territory -- and behind the others. The other indicators in Figure 6 compare Western Australia's completion rates for selected sub-groups with the national average:
Figure 6: Year 12 completion rates, WA vs Australia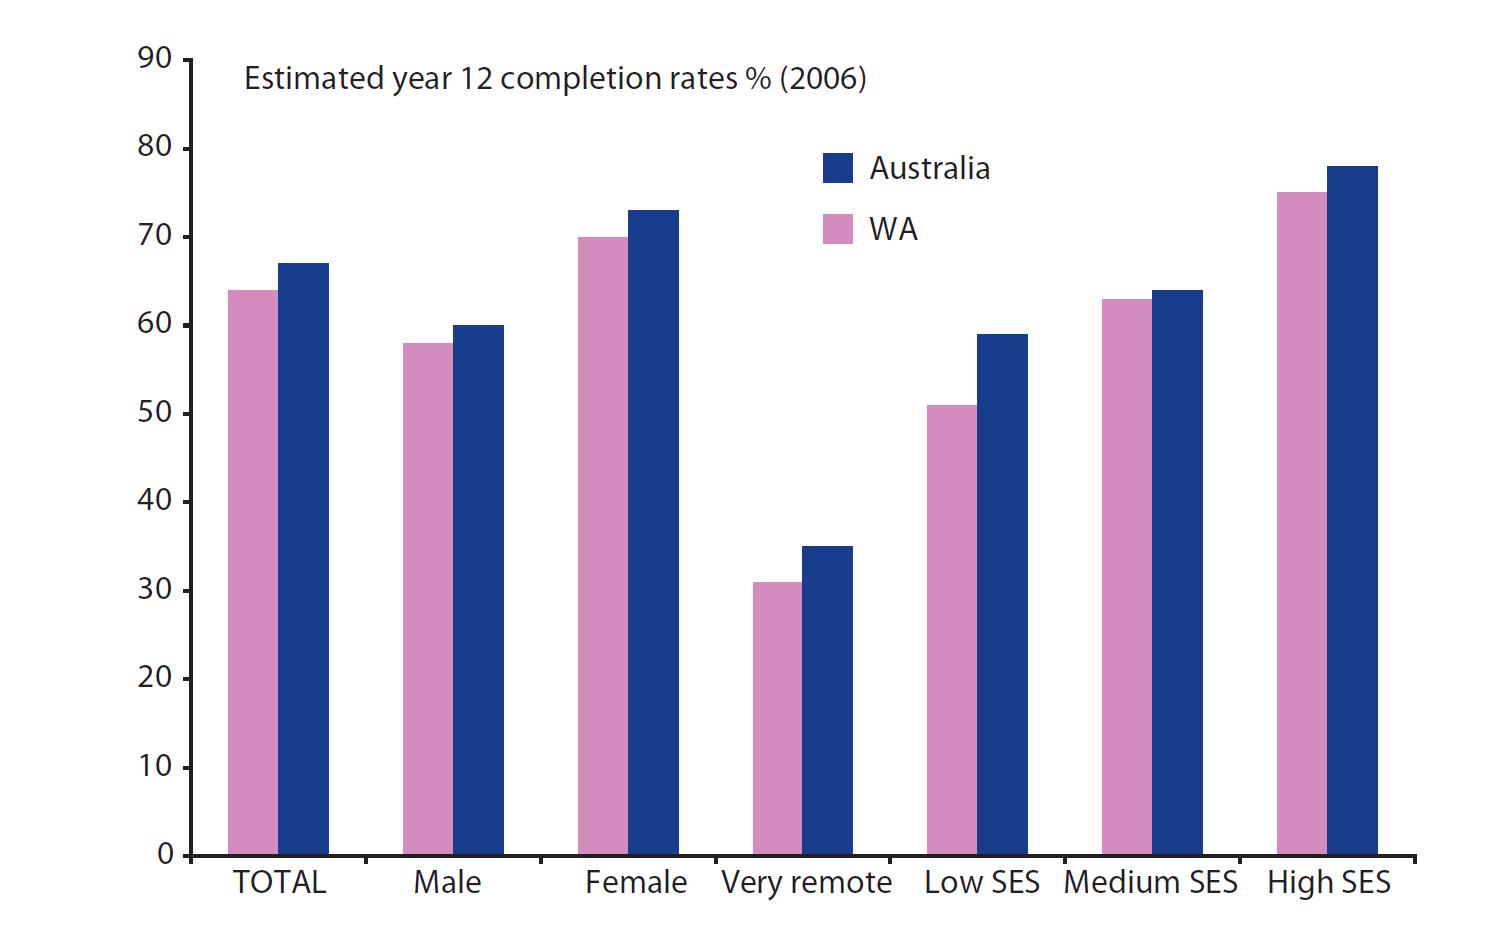 Source: RoGS (2008)Table 4A.1, Table 4A.2, Matthew Ryan
- In all of these sub-groups, WA's completion rates were lower than the national average
- Males generally have lower completion rates than females
- Students in remote or very remote areas have very low completion rates
- Completion rates rise with socioeconomic status: as seen in the three right hand sets of bars. (23)
While the latest completion rate estimates are a little disappointing for WA, major progress has been made in raising completion rates in recent years. Back in 2001, WA year 12 completions were a full 5 percentage points short of the national rate. By 2003, the gap was reduced to 4 points. By 2005, the gap was reduced to 1 point -- before rebounding to 3 points in the latest data. This is shown in Figure 7.
Figure 7: WA completion "gaps" trend down to national average, but has there been a recent reversal?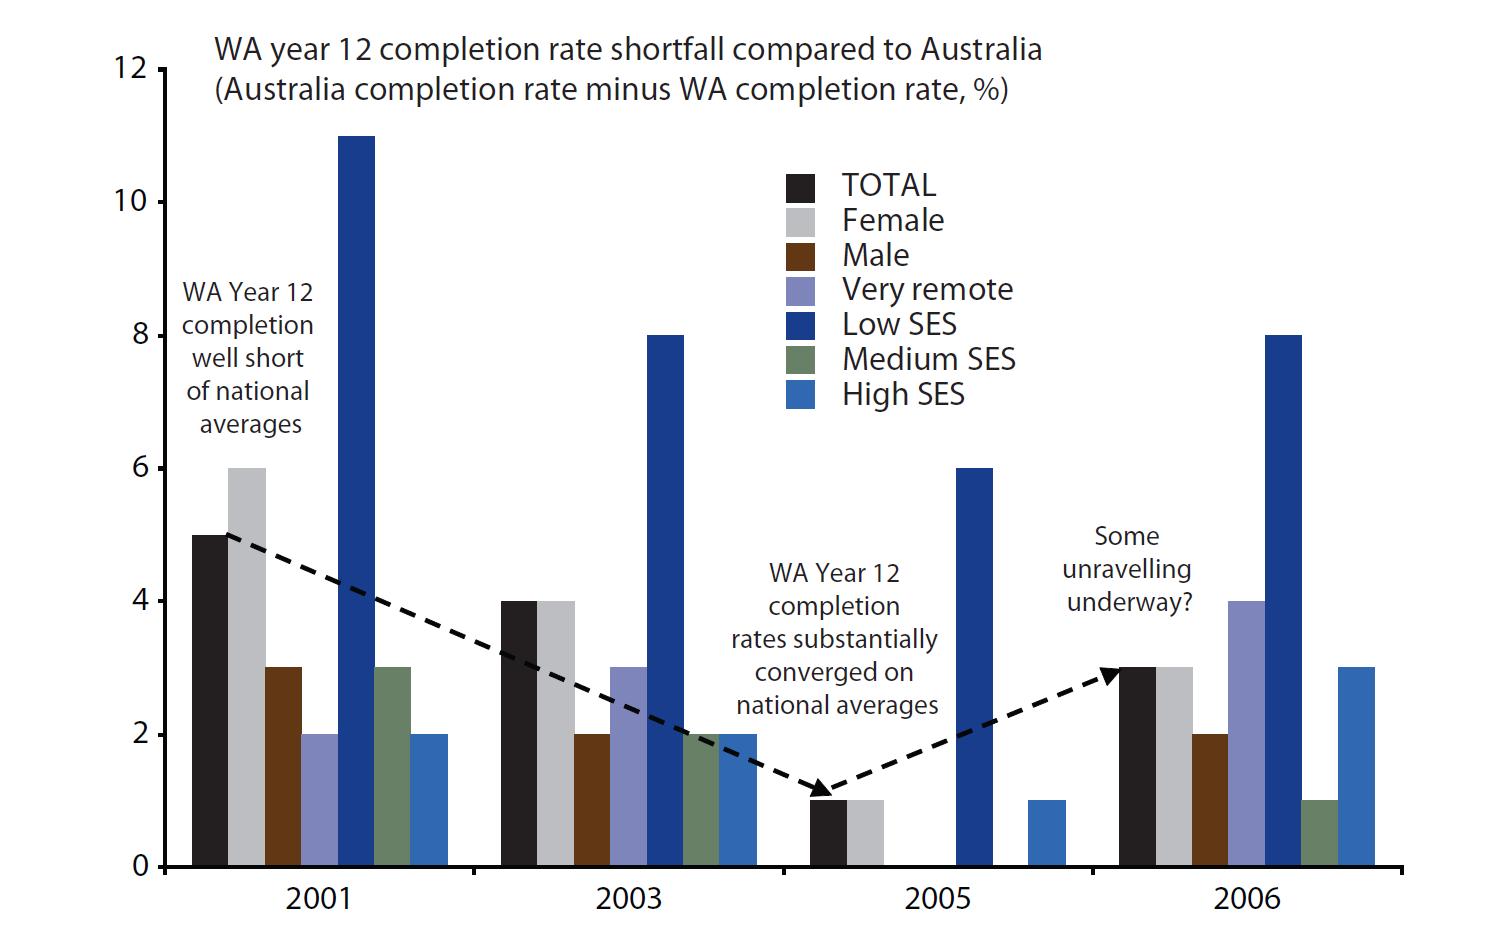 Source: RoGS (2007) Table 3A.122 RoGS (2008) Table 4A.122
The figure shows that there had been quite an improvement in the relative performance of WA schools in attracting and retaining students through to year 12 up until 2005. Furthermore, this progress was across-the-board for the various sub-categories of students: for females and males, for remote students and for students from all SES backgrounds.
The apparent unravelling in this progress in the latest data may well be due to the increased opportunities for WA youth to trade-off extra schooling for well-paid jobs (with perhaps limited career prospects). (24) Since at least around the middle of 2004, WA jobs growth has been stronger, unemployment rates lower and wages have been growing faster than for Australia as a whole.
Western Australia's minimum school leaving age was raised to 16 years in 2006 and 17 years in 2008. This latest move could prove to be very timely.
STUDENT ACHIEVEMENT
How do Western Australian students compare with the rest of Australia?
Student achievement is measured along social, personal and academic dimensions.
Here we will focus on academic achievements. But doing so, is not to belittle the importance of creating "well-rounded and grounded" students. Rather, it must be recognised that the main policy interest is in academic achievement because it bears the closest links to future economic prosperity.
Western Australia, along with the other states and territories, currently provides information on their year 3, year 5 and year 7 student achievements in reading, writing and numeracy. In general, over 80 per cent of Western Australian students meet national benchmarks for competence in these areas.25 (Eventually, nationally comparable year 9 scores will become available.)
Unfortunately, inter-state comparisons of these results are complicated by inconsistent data treatment, not least of which is the large difference in the number of years of schooling faced by students in the different jurisdictions. For example, in 2004 the typical Western Australian tear 3 student (at the time they did their reading test) had an average of 2 years and 7 months of schooling (the least experience in Australia). This relative lack of experience compared with 3 years and 7 months for a NSW or Victorian student. (26)
Presently, there are 5 different school starting ages around Australia. It means that families considering pursuing job opportunities in Western Australia may face obstacles in relocating their school-aged children to WA. For example, a child may be "out of sync" with their Western Australian peers requiring that the child be put back a year.
A national, common school starting age would help ease the relocation difficulties for families wanting to move to WA. Such a proposal would also have made the national data on student achievement more consistent and the states more accountable.
A proposal for a common school starting age was rejected by state and territory education ministers in 2007. In the proposal that was rejected by ministers, the other states and territories would have moved towards the Western Australian and Queensland starting age.
Another set of student tests, without so much of the "barbed wire" of the "nationally comparable" data is the Programme for International Student Assessment (PISA). PISA has the added advantage of international comparability. (27)
PISA tests the learning outcomes of 15-year-olds across the three "domains" of reading literacy, mathematical literacy and scientific literacy. By "literacy", PISA tests for broader skills and understanding, not just the common meaning of being able to read and write.
The size of PISA is something to behold. In the latest PISA (2006), a random sample of almost 400,000 students from 57 countries participated, including nearly 1,500 West Australians from 38 government and non-government schools. (28)
In 2006, scientific literacy was given the most thorough testing (in 2003 it was maths; in 2000, reading and writing).
In scientific literacy, WA students scored an average of 543 on the science scale in 2006, the second highest in Australia after the ACT -- see Figure 8. Educationists are particular about the interpretation of their data so it should be mentioned that PISA results are published as ranges rather than point estimates. So although WA students averaged 543, the "true" average of all WA students (not just the ones who were surveyed) probably (29) lies somewhere between 529 and 557.
Figure 8: WA science students amongst Australia's top performers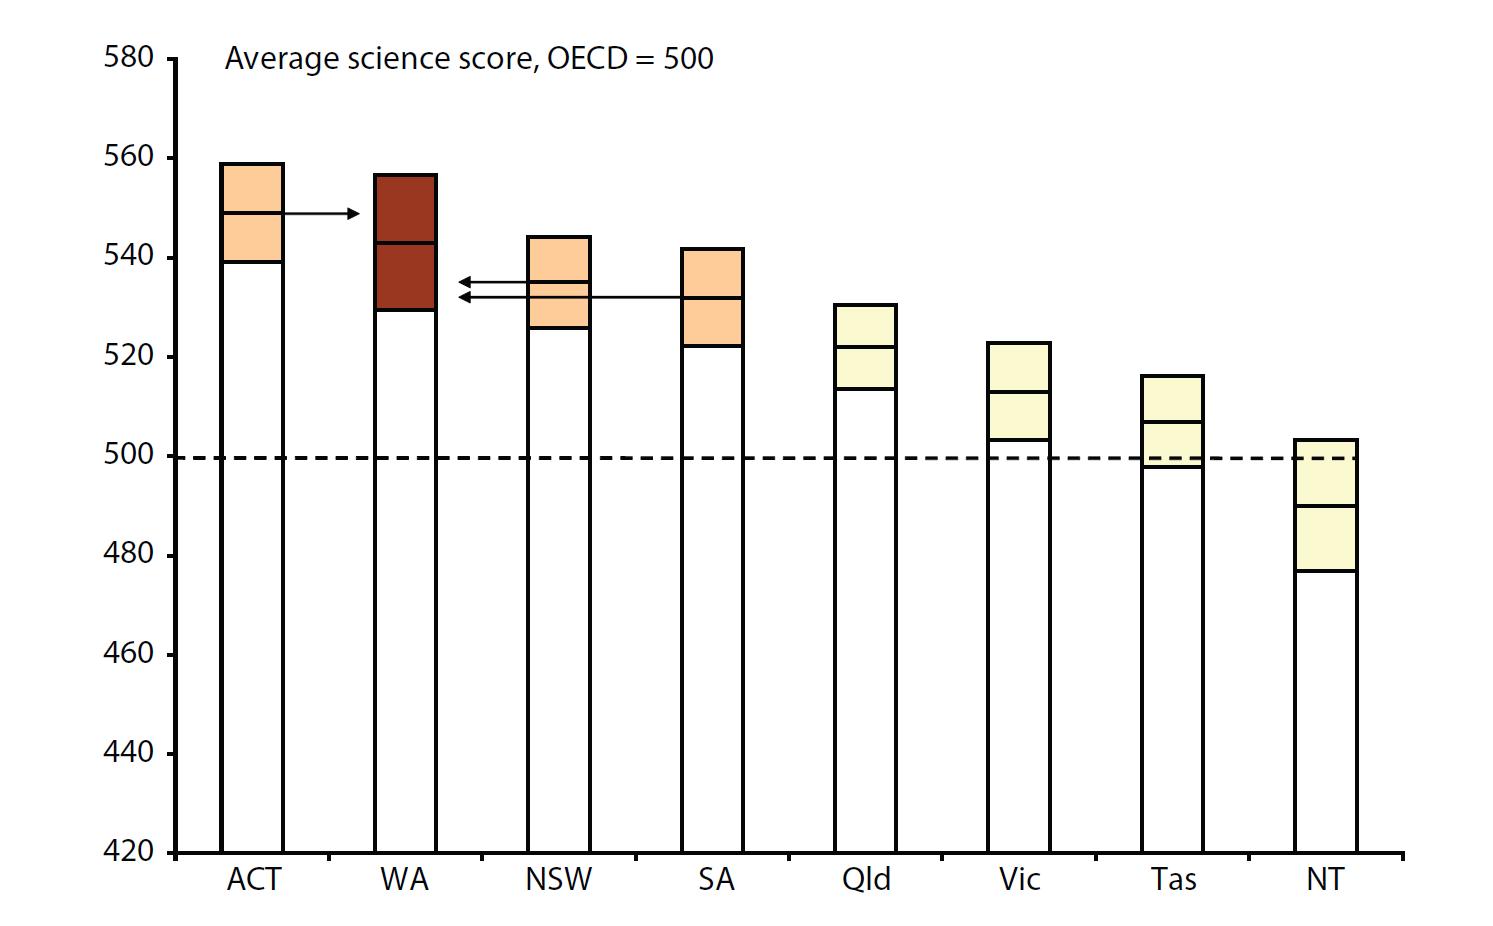 Source: PISA 2006, "Science Competancies for Today's World" (2007), "Exploring Scientific Literacy from Australia's Perspective" ACER (2008), Table 3.2
This uncertainty about WA's true average is indicated by the dark brown range for WA in the figure. Similar uncertainty applies to the other states' results. The upshot is that if other states' averages (indicated by the horizontal arrows) fall within the brown range for WA, we can't be sure that WA's average is different from the average for these states. States in the same "ballpark" as WA include ACT, NSW and SA (the "light brown" bars).
But we can say that WA outperformed Queensland, Victoria, Tasmania and the NT (light yellow bars).
In mathematical literacy, WA achieved similar results to the ACT, NSW, SA and Queensland and significantly better results than Victoria, Tasmania and the NT -- see Figure 9.
Figure 9: WA maths students amongst Australia's top performers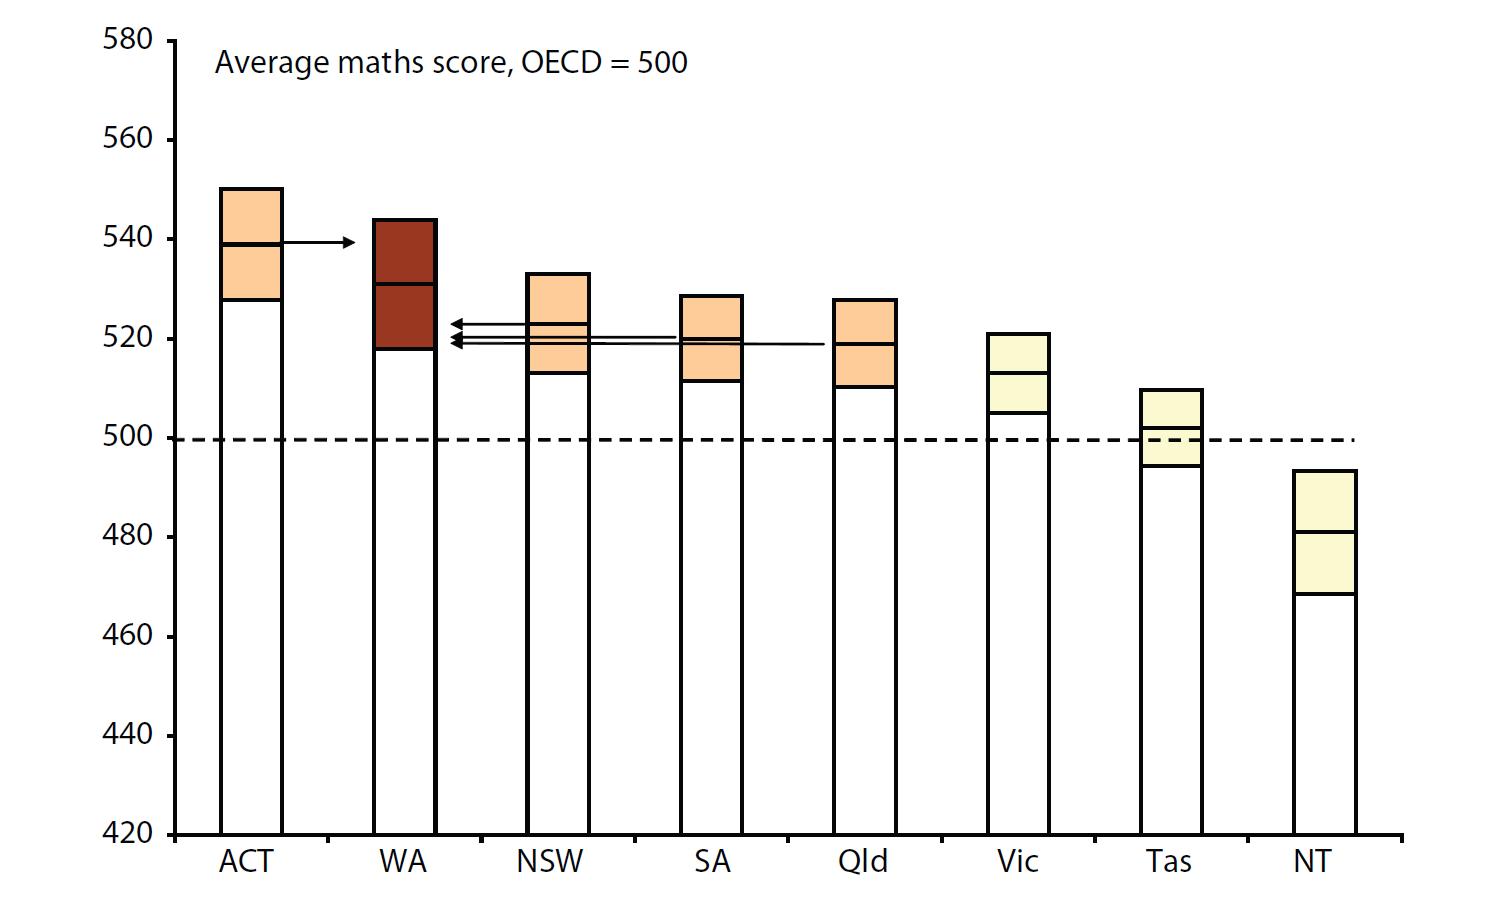 Source: PISA 2006, "Science Competancies for Today's World" (2007), "Exploring Scientific Literacy from Australia's Perspective" ACER (2008), Table 6.1
Finally, in reading literacy, WA performed on a par with NSW and SA and outperformed those of the other states and the Northern Territory. See Figure 10.
Figure 10: WA student literacy amongst Australia's highest Source: PISA 2006, "Science Competancies for Today's World" (2007), "Exploring Scientific Literacy from Australia's Perspective" ACER (2008), Table 5.2
What about disadvantaged groups?
While averages are a good indicator of overall student achievement, they don't show what is happening to disadvantaged student groups.
Figure 11 shows Australian (30) student scores (for science) by region, indigenous status, migrant status and social background. As before, the coloured bars show the range of uncertainty around the estimated average score with the middle horizontal line between the coloured bars indicating the average.
Figure 11: Australian science scores by region, social background, migrant and indigenous status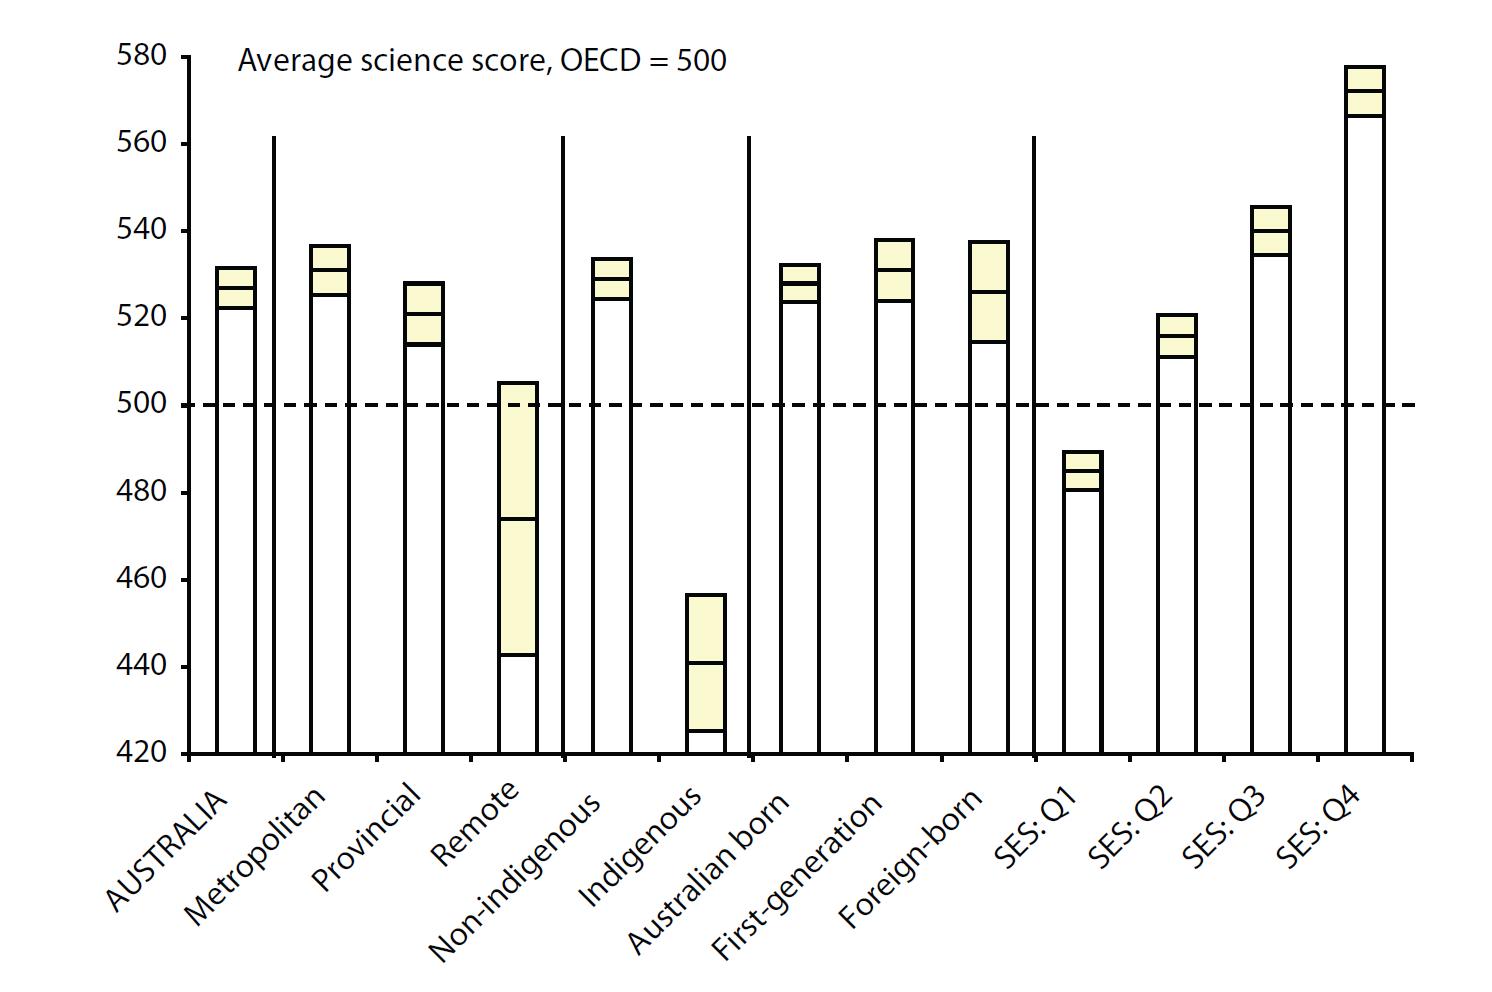 Source: "Exploring Scientific Literacy from Australia's Perspective" ACER (2008), pp73-76
Regional students
Scores decline a little for students living in provincial areas and a lot for students living in remote areas. There would seem to be room for Australia to improve its outcomes here.
Indigenous students
There is a large gap between the average scores for indigenous and non-indigenous students. This is of enduring concern. (Note the overlap here with the relatively low scores for remote area students.)
Foreign students
Scores differ little between second (third, fourth...) generation Australian students and students who are first generation (born here to migrants) or who were born overseas. Australia's school system appears to plays its part in integrating migrants.
Students from families with low socio-economic status (SES)
As can be seen in the figure, scores rise with students' social and economic status. Students in the bottom quarter of SES scored an average of 485 (in the figure, SES: Q1) whereas students in the top quarter scored an average of 572 (SES: Q4).
The relationship between SES and students' scores is often taken to be a broad indicator of the equity of a country's school system. In all countries, the relationship is positive: high income, highly educated parents in high status jobs tend to produce higher achieving children.
However the strength of this relationship is surprisingly weak: if you knew the socio-economic status of an Australian student, you would be able to correctly guess their PISA scores in science, reading and maths only 10 to 11 per cent of the time. (31) In the "lucky dip" of life, being born into an elite social class accounts for little in terms of how raw human capital is distributed in Australian society (as measured by 15 year olds' PISA scores).
Furthermore, because of our high average student scores and weaker than average relationship between SES and student scores, Australia is regarded as having a "high performance, high equity" school system, Western Australia particularly so. (32)
Unfortunately this fact is not recognised by some of Australia's most senior education policy advisers, who insist on describing Australia as having a "high quality, low equity" school system. (33) As faulty conclusions can lead to faulty policy recommendations, this is one myth that needs to be "debunked".
To quote Thomson et al in their summing up of Australia's performance (at page 243):
Australia was characterised as high performance but low equity in PISA 2000 in reading literacy, and as high performance and high equity in PISA 2003 in mathematical literacy. In 2006, scientific literacy in Australia is again high performance and high equity. [emphasis added]
How do Western Australian students compare with the rest of the developed world?
Because PISA is international, we can compare WA students with those of the rest of the developed world -- see Figure 12.
Figure 12: WA science students amongst world's top performers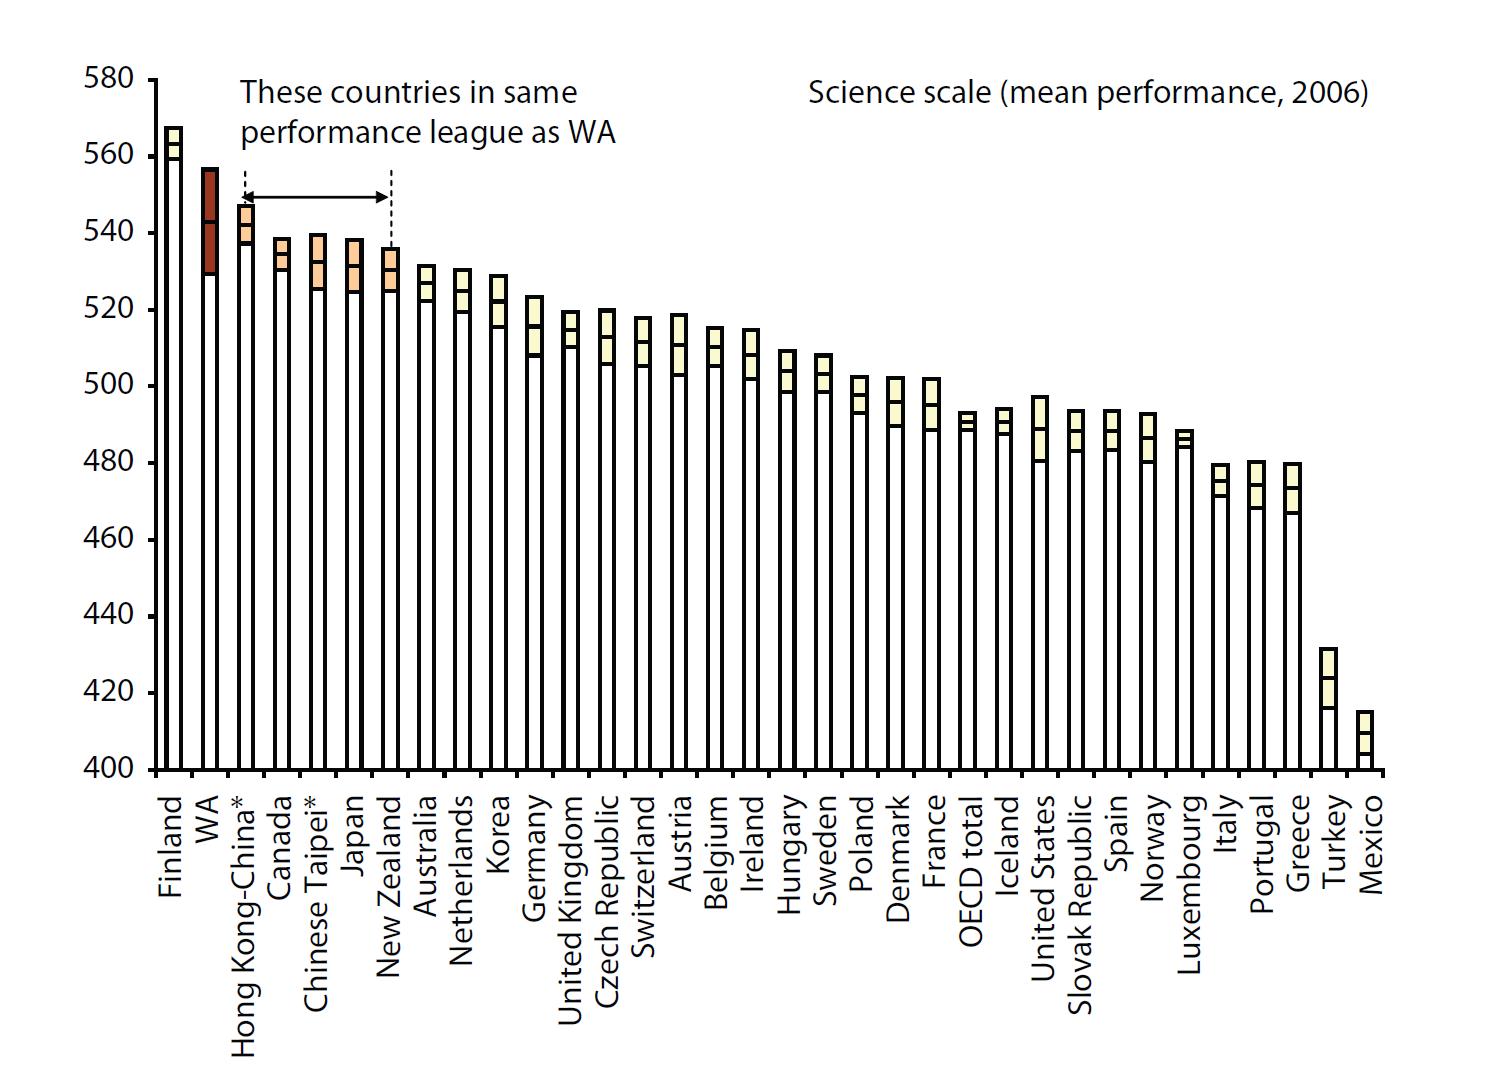 Source: PISA 2006, Table 2.1c, PISA from Australia's perspective, Table 3.11
While Australia was significantly outperformed in scientific literacy by Finland, Hong Kong-China and Canada, this is not the case for WA. Only Finland clearly outperforms WA.
In addition, only a small group of countries are in the same performance league as WA: Canada, Japan and NZ (amongst OECD countries) and Chinese Taipei and Hong Kong (from the other PISA participating countries).
Many international educationists make the grand trek to their "poster child" -- Finland -- to learn its "secret". Perhaps instead they should be trekking to WA: they would have a better time and would learn about how to school in a mixed global society, not a frozen monoculture with an indigenous population of only 0.1 per cent.
Gifted students
While averages are a good indicator of overall student achievement, average students are unlikely to go on to make the next great discovery (such as the real cause of stomach ulcers); only the very top performers are contenders. These very top performers may well go on to generate economic prosperity in ways that we can only imagine -- or as Bill Gates is claimed to have said: "we need to be nice to nerds as one day we might end up working for them". (34)
It is worth noting that Western Australia is stacked with top-performing 15-year-olds. Across the OECD, just over one per cent of students achieved the top level of proficiency in science, while in Finland this proportion was almost four per cent. A similar proportion was achieved in Western Australia (as well as the ACT, and NSW). In the other Australian states, the proportion of students achieving the top proficiency level was two to three per cent (35) -- still well above the average for the OECD.
Value for money
Does the Western Australian school system provide a good value for its money? One way of measuring value for money is to compare a broad measure of student outcomes with a broad measure of taxpayer support for schools.
Figure 13 provides such a comparison. It compares the average of the PISA scores (science, math and reading) along the bottom axis with average public funding per student along the left vertical axis. This is done for each Australian state and territory (for 2005-06).
Figure 13: Value for money -- WA vs Australia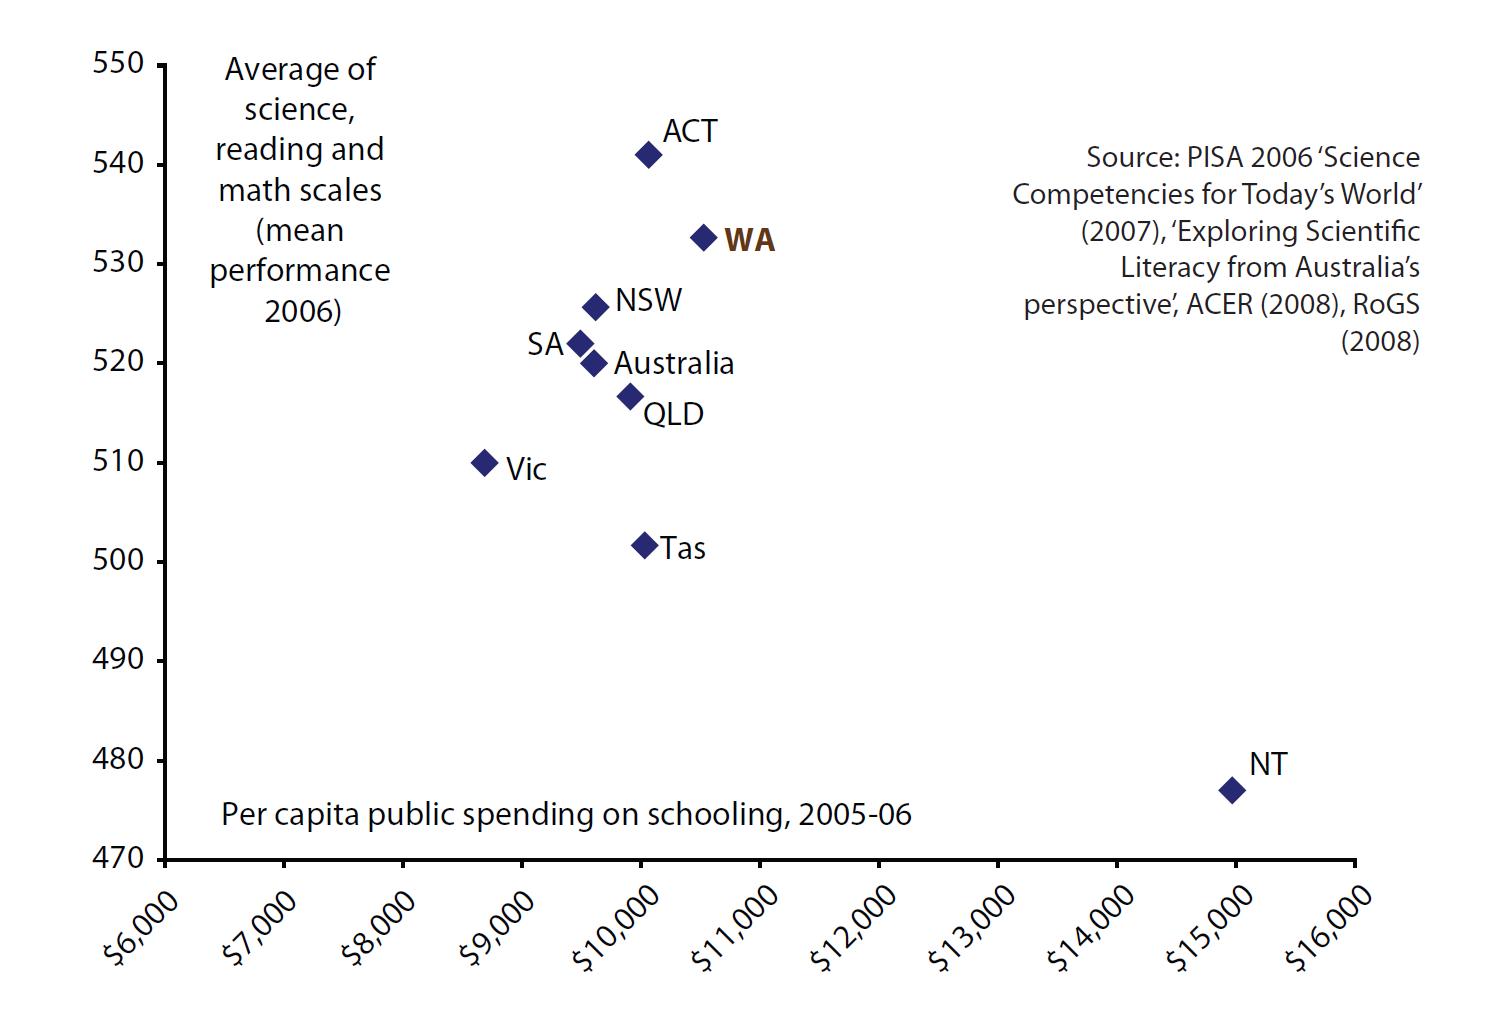 Source: PISA 2006 "Science Competencies for Today's World" (2007), "Exploring Scientific Literacy from Australia's perspective", ACER (2008), RoGS (2008)
The perfect place to be in Figure 13 is in the top left corner: that is, outstanding student scores with no cost to the taxpayer. The spot is vacant. In the real world, high performing students come at a price. Both WA and ACT have strongly resourced school systems -- the ACT particularly so given that it does not have high cost remote areas to maintain; nor does the ACT have a highly disadvantaged indigenous population.
As it happens, WA and the ACT also have the best performing 15 year old students in Australia as measured by PISA (as shown along the vertical axis). We can also compare WA's value for money with other countries (36) -- see Figure 14.
Figure 14: Value for money -- WA vs world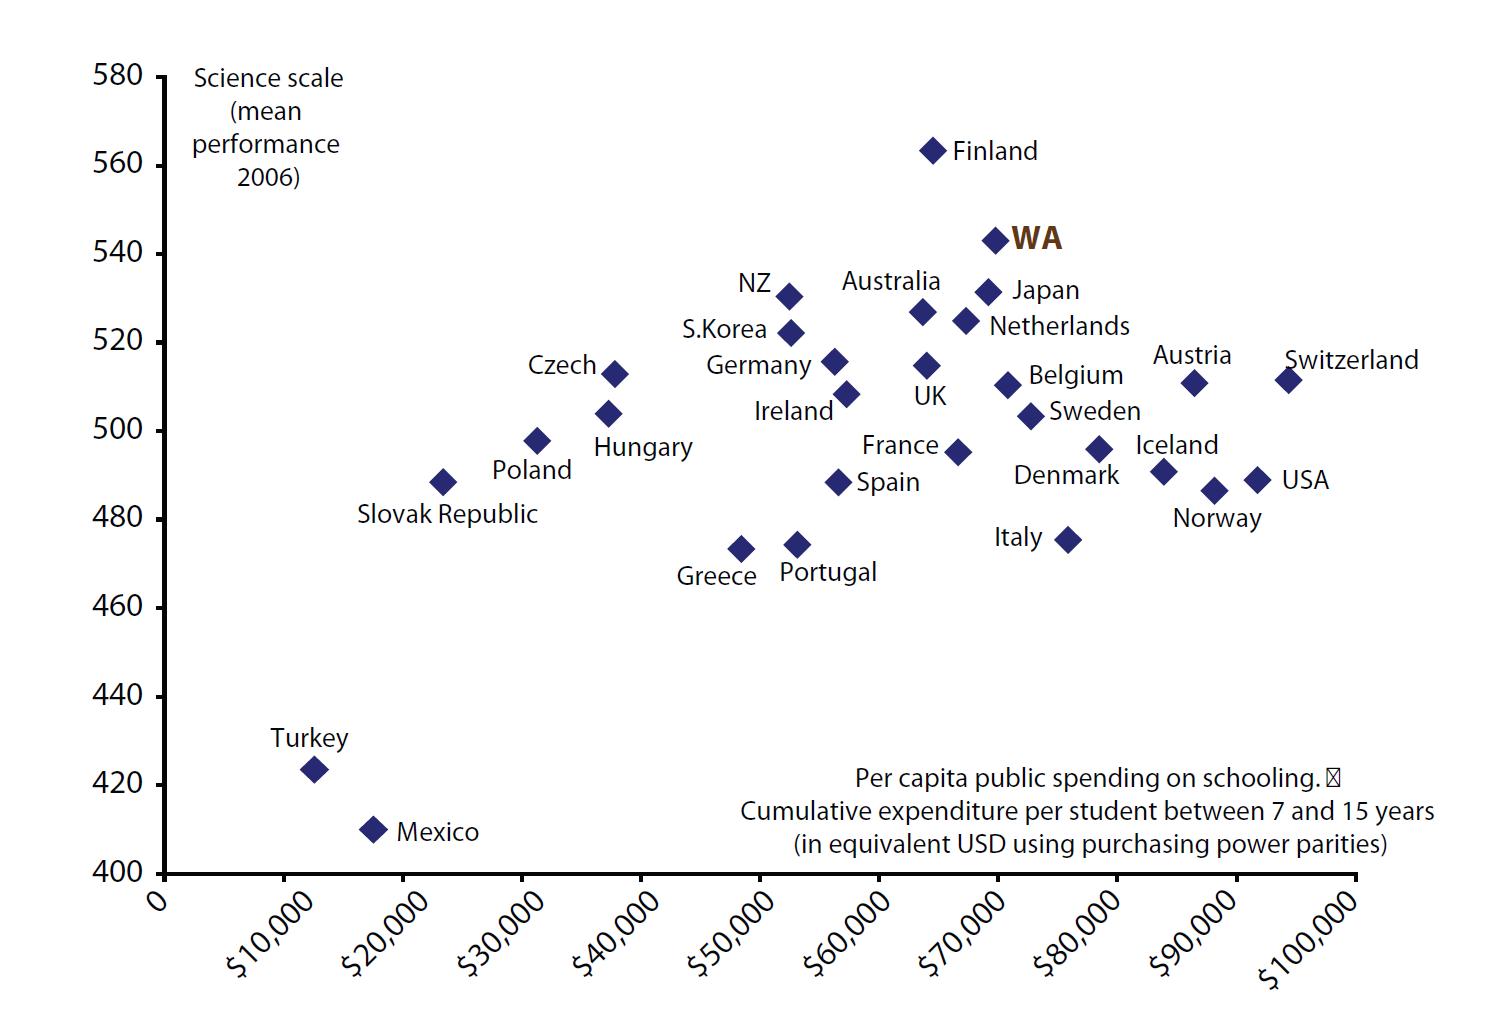 Source: PISA 2006 "Science Competencies for Today's World" (2007), "Exploring Scientific Literacy from Australia's perspective", ACER (2008), Matthew Ryan (estimate of WA school spending)
Again, WA stands out as a top performer in terms of this measure of value for money'. (37)
On the other hand, if you were an American or an Italian you might feel a little peeved at the poor performance of your country's schools given the drain on your pockets.
MAKING A GOOD SYSTEM EVEN BETTER
The remainder of this paper will make a number of suggestions for where priority should be given to further strengthening the current arrangements at an institutional level.
NURTURE INSTITUTIONS FOR CONTINUOUS IMPROVEMENT
Western Australia, like Australia as a whole, has an excellent record of achievement in its school system. Was it just luck? Are our students just naturally very clever? Or is there something about our education institutions (our policy makers, principals, teachers, parental involvement) that pushes us towards having amongst the world's best students?
It is not likely that our students are innately brighter. Neither is it likely that we have been particularly lucky. However, we may have been lucky in our schooling "institutional framework". As in other areas where Australia has outperformed -- such as sports, macroeconomic policy, corporate governance -- "institutions matter".
The institutional framework for our schools might be best described as a feedback loop which has the effect of encouraging continuous improvement. The loop is:
- We monitor student outcomes as part of state, national (Report on Government Services) and international processes (PISA).
- In response to those outcomes, we refine our understanding of the links between school inputs and student outcomes. With the right incentives in place, school inputs are adapted with the aim of improving student outcomes. Repeat the loop from (i).
The adjustment of school inputs at step (ii) is encouraged by competition between school providers at various levels which acts to weed out sloppy arrangements and to stoke higher standards of student achievement.
At the highest level, our schools face limited international competition. Our involvement in international student testing (PISA) informs us of our relative performance in student achievement. In the (unlikely) event that standards in Australian schools were to radically decline then the number of foreign students in senior grade years in Australian high schools would likely fall off. Secondly, Australian parents might be tempted to consider foreign schools (such as in Singapore, New Zealand or Canada) for their senior students.
At the next level down, our system of federation encourages competition between the states and territories and provides a limited check on failed educational policies at the state/territory level.
At another level, competition between school systems (government and non-government) within each state and territory provides a more substantive check on failed arrangements at the system level. Parents may exercise their choice in whether their child attends a government or non-government school. While parents' choice is financially biased towards government schools, (38) the choice is still there.
Competition between schools provides a check on failed arrangements at the school level. This competition is enhanced when schools report their performance to parents and others in the community. (39) The Western Australian "School Accountability Framework" provides a good model. (40) Competition between government schools is heightened when parents are not limited to the local school but may choose schools further a field. Again, the Western Australian model allows this. However, when a WA government school becomes "too attractive" (when there are not enough places for the number of students wanting to enter), student entry is rationed according to how close the student is from the school. (41) For families able to afford to relocate in the more expensive homes near the best government schools, the current rationing system is not an issue. For less well-off families, the options are more limited.
Finally, there is a degree of competition between teachers to be "the best" with all of the rewards associated with being a successful professional. Each of these levels of competition "chunk up" into higher levels of cooperation:
- Teachers and principals co-operate in the running of schools.
- The leadership of schools co-operate in running aspects of government and non-government school systems.
- These in turn co-operate with policy makers in the running of state education systems.
- The states co-operate with the Commonwealth in policy decisions affecting the nation (MCEETYA). (42)
- Australia co-operates with other countries in analysing education policies and performance data (at the OECD including the use of the PISA).
At first glance, competition at each of these five levels might look "wasteful" -- an argument that might go down well in a highly centralised (and underperforming) school system such as that of France's. ("If only we had one national school system we could save money on ministers for education, policy bureaucrats, ensure our school buildings were full ..." etc.)
If competition was eliminated it is narrowly true that schools could operate more cheaply and efficiently. But this argument applies more broadly. If Australian drivers choices were limited to one make of car then we could also eliminate much "waste" in the production, distribution and repair of our car fleet. But with no choice, the incentives to aim for world's best practice in car making would disappear.
That is why, in the case of motor cars, we accept the loss of "static efficiency" in order to gain the benefits of "dynamic efficiency". (43) Likewise, competition at each of the five levels of school policy formation helps ensure that we make the right decisions in allocating scarce school resources.
Crucially, these arrangements allow innovations to "filter up from below". To give one example, a teacher may accidentally hit on a particularly effective method of dealing with school truancy -- such as texting parents on their mobile phones when children are unexpectedly absent from roll call. This innovation might then be trialled by all teachers for the whole school. If successful, this method might then be trialled for a state government or non-government school system -- and so on with the anti-truancy policy potentially becoming recognised as world best practice. The point is that innovations from below are low risk -- if they don't work, they are not applied more broadly. With a large and centralised education system there is less scope for trial and error.
These arrangements also allow best practice to "filter down from above" from shared international experience or from experience in other Australian jurisdictions. Innovations from above are trickier and higher risk and have triggered some of our fiercest debates -- such as the recent debate about the net benefits of having a nationally common school starting age. The difficulties arise because there is often room for legitimate disagreement as to whether certain standards should be centrally determined or not.
The central strategic policy point of this paper is that we should nurture all of these feedback loops in the formation of the running of our schools:
- Competition between state education systems is healthy
- Competition between government and non-government school systems is healthy
- Competition between schools is healthy; and
- Competition between teachers to succeed at their careers is healthy.
As always, competition needs to come with certain ground rules:
- As far as possible we should provide "level playing fields" for all of the players
- Make sure none of the players are cheating or manipulating their test scores. We could make inter-state student achievement comparisons more transparent by removing some of the "barbed wire" making comparisons difficult; and
- That there is honest dealing between the competitors.
SUPPORT EFFORTS TO IMPROVE OUR UNDERSTANDING OF THE LINKS BETWEEN SCHOOL INPUTS AND STUDENT OUTCOMES
All of the players in our school system -- policy makers, principals, teachers and families -- have an interest in understanding how they can improve student outcomes.
The goal of the exercise is to improve student outcomes. If improving teacher satisfaction is part of that process, well and good. If we have to make a choice between improving student outcomes and keeping teachers happy -- it shouldn't be controversial to state that "students must come first".
There is a host of research from Australia and overseas into the links between school inputs and student outcomes. ("School inputs" includes all of the underlying drivers of student achievement such as the quality of their teachers and the organisation of the school including morale and facilities etc.) This type of research helps inform good policy and decision making at each level of school policy formation. The recent review, led by Professor Bill Louden from the University of Western Australia, into how to raise literacy and numeracy for WA's young children (who are not meeting the benchmarks) is an excellent example. (44)
By way of background, the sources of student performance are sixfold (45) and their quantitative link to student achievement is illustrated in Figure 15. (46)
Figure 15: What drives student achievement?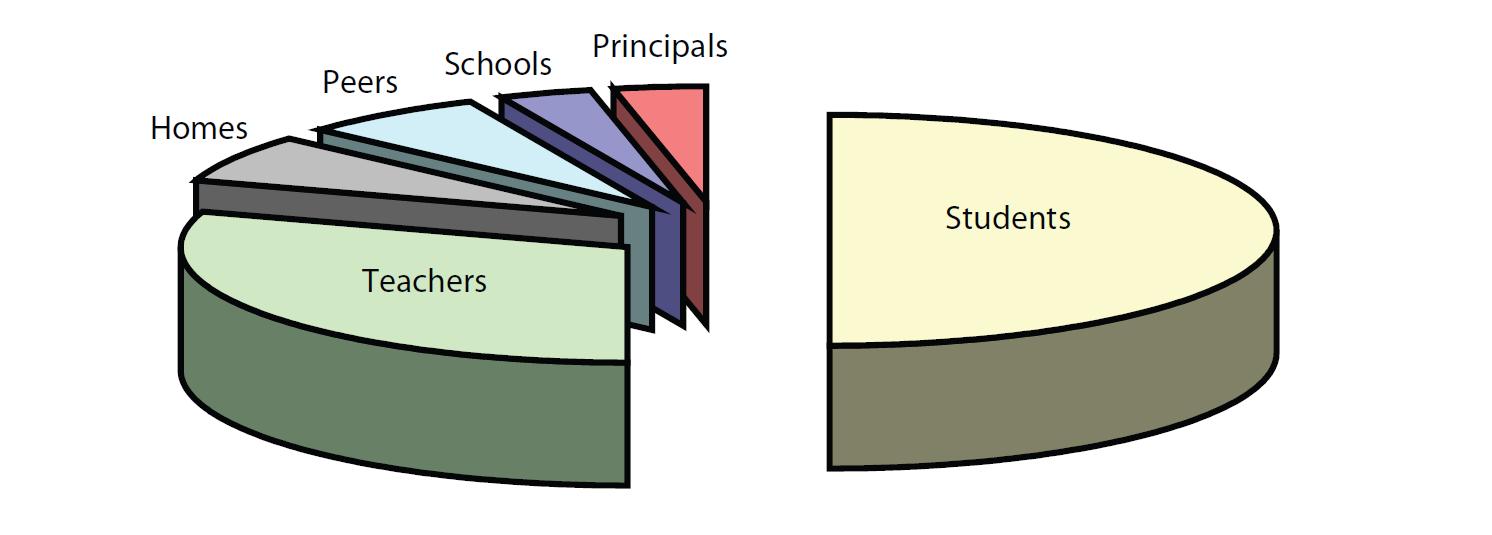 Source: Adapted from Hattie (2003)
Students -- the characteristics of students (which is a combination of genetics and life experience) accounts for about half of their performance.
Home -- home life has an additional influence (beyond moulding students' life experiences) on student performance in motivating and forming students' expectations and accounts for about 5-10 per cent of student performance.
Schools -- including their principal, their finances, their size, class sizes, the buildings -- accounts for about 5-10 per cent of student performance.
Principals -- responsible for leading and influencing a school's culture (included in "Schools" above).
Peer effects -- children competing with a strong peer group tend to lift their performance. Children competing with a weaker peer group tend to lower their performance. Peer effects account for about 5-10 per cent of student performance.
Teachers -- account for about 30 per cent of the variance. It is what teachers know, do, and care about which is very powerful in driving student achievement.
The policy implications of Figure 15 are clear.
- What students "bring to the table" is the most important determinant of their success. However, there is little that policy can do – even in the long run – to change students' innate abilities or the social life of their family and community.
- There are few obvious, acceptable policies for raising the quality of parenting and raising parents' expectations for their children.
- Policy can improve school infrastructure and reduce average class sizes. The quality of school leadership can be raised. But the combined effects of these policies are quite minor.
- Policy could raise the quality of peer interactions for selected students -- but at the cost of lowering the quality of peer interactions for others.
The standout factor which is both important and policy can positively influence is the quality of teaching.
REINFORCE TEACHING AS A PROFESSION
Despite the importance of teaching to student achievement, nationally, teaching remains a somewhat reluctant profession.
In a world of expanding graduate career opportunities, teaching has become much less competitive with the rsult that the quality of new graduate teachers has been declining. Andrew Leigh and Chris Ryan at the Australian National University found that in 1983, the average person entering Australian teacher education was in the top 26 per cent of the talent pool. By 2003, this had slipped to the top 39 per cent. (47)
That said, Western Australia is doing its bit to reverse this decline and raise the status of teaching.
WA leads the country in paying new graduate teachers. A four year trained teacher has a starting salary of around $50,000 pa. (48)
At the other -- highly experienced -- end of the teaching profession, a "Level 3" classroom teacher in WA can presently earn $77,744 pa base salary. (49) This also appears to be the highest teacher salary on offer in Australia (by a few thousand dollars).
Notice that peak teacher salaries are about one and a half times teacher starting salaries. That is, there is not a huge "gradient" in pursuing a teaching career. By contrast, top professionals in law, accounting, medicine and other fields can expect to earn multiples of their starting salaries, not around one and a half (or even two). If teachers want to earn more than around one and a half times their starting salaries, they need to move out of the classroom and into administration or other fields (or perhaps into non-government schools).
Professional development of teachers is one of the major ways in which we can lift the quality of teachers. (50) WA has strong support structures in place, including the Professional Learning Institute which (under the umbrella of the Department of Education and Training) aims to raise the bar on the quality of teaching, the quality of leadership and the quality of organisational support. (51)
Features that are common to a number of other professions, such as performance bonuses linked to achieving agreed outcomes ("performance pay") remain controversial when they are considered for application to the teaching profession. When performance pay was first mooted (by the then Federal Education Minister in 2007), the then Australian Education Union president rejected it as "completely unreasonable to hold a teacher responsible for outcomes". (53)
There is of course no contradiction between having passion for a job and being rewarded for success. One of the concerns with performance pay is that it would unfairly disadvantage teachers with below-average students. To avoid this concern, one of the performance pay components to teachers' salaries should be linked to their "value add" to student performance. By "value add", teachers are rewarded for making their students smarter, not for having smart students -- and, yes, this can be measured.
There appear to be no performance pay processes in WA government schools. Performance pay may be worth considering in dealing with the most enduring failures of all Australian schooling: in raising the outcomes for indigenous (and especially remote indigenous) students.
The recent proposal from the Cape York Institute provides a model for how teacher performance pay might work. (54) The "Teach for Australia" proposal would apply a (tax-free) (55) loading of $50,000 per year (experienced teachers) and $20,000 (for graduate teachers) for those teachers prepared to work with students in the most disadvantaged indigenous communities. Graduate teachers would be targeted from the top ten per cent of year 12 students. The loadings would continue only for those teachers whose students meet agreed achievement standards (including monthly literacy and numeracy tests).
THE WAY AHEAD
Western Australian schools policy should have two long run strategic aims. First, schools policy should support the WA economic boom. Second, school policy should nourish competition amongst the different players in applying evidence-based analysis aimed at improving student achievement.
(1) Schools policy will help make the boom work for Western Australia
Thanks to the booming economies of Asia, Western Australia is on a higher growth path than the south and east of Australia. Since at least around the middle of 2004, WA jobs growth has been stronger, unemployment rates lower and wages and prices have been growing faster. Resources -- both human and physical -- are likely to continue to relocate to WA from the eastern states (and from offshore) in the years ahead. (56) This needs to happen if WA wages and prices are not to grow too quickly, threatening WA's (and Australia's) growth prospects.
WA schooling policies can play their part in facilitating the transfer of resources from the east.
Making WA teacher salaries attractive by national standards is one such important adjustment. If, down the track, paying more for teachers threatens to "blow the budget", WA could consider letting average class sizes grow as there appears to be good trade-off between raising teacher quality even at the expense of increasing class sizes. (57)
WA should also support moves towards harmonising teacher registration across Australia. This will make it easier for WA to shift teachers from the eastern states. Support for other national standards -- such as a national common school starting age -- would also help other Australians to make the shift to WA.
Finally, thanks to the boom, it is easier to get a job in WA, including for teenagers. There is a risk that WA teenagers may be tempted by the immediate cash benefits of a lower skilled job thereby putting their schooling at risk. There is some recent evidence that this could already be happening. (58) Accordingly, the increase in the minimum age for leaving school in WA to 17 years in 2008 could be timely. (59)
(2) Maintain adaptable institutions
If there is a "secret" to the success of Western Australia's schools (and Australia's schools) it may well lie in the fact that we have successfully built institutions at a number of levels that compete with one another in applying evidence-based analysis. It is no coincidence that most of the world's top school performers are either very small (Finland, Hong Kong, New Zealand) or are federations (Australia, Canada). Being small -- or being part of a federation -- makes for more responsive, adaptable institutions.
We should therefore be particularly careful about any policies that could undermine our comparative advantage in having flexible, competing school policy making institutions.
In particular, Western Australia's school policy makers should be cautious with regard to any proposals which have the effect of transferring policy decisions to Canberra. If there are clearly net benefits for WA from a centralising proposal, by all means proceed -- but Western Australians should be sceptical in weighing up the evidence offered to advance any such proposal.
Another risk is that, as a nation, we misinterpret future measures of student achievement. It is likely that in coming years that the other billion people in the developed world will improve their school systems -- in part by copying our example. As clever as WA students undoubtedly are, it is not reasonable to assume that they will continue to at least match the top 15 per cent and clearly outclass 85 per cent of students from the developed world forever.
When the rest of the developed world gets its act together, our relative standing will appear less impressive because other countries will have learned to match our best practice. However, so long as our own standards remain in touch with the leader(s) and there is no drift down in the absolute level of WA student scores over time, there is no cause for panic or for a radical overhaul of our institutions.
Instead, our flexible and competitive school system will prove to be of most value when it is allowed to continue to test out innovations from the "bottom up" -- with only cautious reliance on directives from the "top down".
BIBLIOGRAPHY
Ainley, John, Gary N. Marks, Ken Rowe and Adrian Beavis. "Aussie Schools are not so 'undemocratic' ". Educare News: The Independent Journal of Australian Education, 138: p41-42. July 2003.
Australian Bureau of Statistics. "Survey of Education and Work", 2006. Reported in "Australian Social Trends, 2007", ABS cat. 4102.0.
Australian Bureau of Statistics. "Western Australian Statistical Indicators", ABS cat. 1367.5. December 2007.
Commonwealth of Australia. "Intergenerational Report 2002-03, Budget Paper No. 5", 2002.
Council for the Australian Federation. "Federalist Paper 2, The Future of Schooling in Australia". September 2007.
Council of Australian Governments, "Communique", 10 February 2006.
Department of Education and Training in Western Australia. "School Accountability Framework". 1 July 2005.
Department of Education and Training in Western Australia. "Enrolment". 1 May 2003.
Department of Education and Training in Western Australia. "The School Education Act Employees' (Teachers and Administrators) General Agreement 2006".
Department of Education and Training in Western Australia. "Annual Report 2006-07". 19 October 2007.
Department of Education and Training in Western Australia. "Literacy and Numeracy Review: Final Report". March 2007.
Hattie, John. "What Makes Teachers Make a Difference. What is the Research Evidence?" Australian Council of Education Research (ACER) October 2003.
Lange, Oskar and Fred M. Taylor. On the Economic Theory of Socialism, University of Minnesota Press. 1938.
Leigh Andrew. "How Can We Improve Teacher Quality?", Melbourne Review, No. 3 November 2007.
Leigh, Andrew. "Schools Need a Report Card Too", Australian Financial Review, 20 December 2007.
Leigh, Andrew and Sara Mead. "Lifting Teacher Performance", Progressive Policy Institute, April 2005.
Leigh, Andrew and Chris Ryan. "Estimating Returns to Education: Three Natural Experiment Techniques Compared". Discussion Paper, No. 493. Centre for Economic Policy Research, ANU, August 2005.
Louden, Bill. "School Performance: what makes the most difference -- and what would it take to get more of it?" Presentation to "Our Schools.. Our Future" conference. University of Melbourne, 15 November 2007.
Ministerial Council of Employment, Education, Training and Youth Affairs (MCEETYA). "National Report on Schooling". Various years.
McKinsey and Company. "How the world's best-performing school systems come out on top". September 2007.
OECD. "The New Economy, Beyond the Hype: The OECD Growth Project", OECD 2001.
Professional Learning Institute website.
Ryan, Matthew. "Public Funding of Australian Schools: The Facts", Research Paper for Association of Independent Schools of Victoria, July 2007.
SCRGSP (Steering Committee for the Review of Government Service Provision), "Report on Government Services 2006", Productivity Commission, Canberra. 2006.
SCRGSP (Steering Committee for the Review of Government Service Provision), "Report on Government Services 2007", Productivity Commission, Canberra. 2007.
SCRGSP (Steering Committee for the Review of Government Service Provision), "Report on Government Services 2008", Productivity Commission, Canberra. 2008.
Thomson, Sue, John Cresswell, Lisa De Bortoli. "Facing the Future. A Focus on Mathematical Literacy Among Australian 15-year-old Students in PISA", Australian Council for Education Research (ACER) 2004.
Thomson, Sue, Lisa De Bortoli. "Exploring Scientific Literacy, How Australia Measures Up" Australian Council for Education Research (ACER) 2008.
The West Australian. "Treasury wants Qld, WA migration boost". January 19, 2008.
REFERENCES
1. OECD. "The New Economy, Beyond the Hype: The OECD Growth Project", OECD 2001
2. OECD. "The New Economy, Beyond the Hype: The OECD Growth Project", OECD 2001, p71
3. This estimate was independent of "ability bias" -- the fact that ability and years of school attendance are associated. The other natural experiments related to differences between the states regarding school starting ages and differences in school results between twins. See Leigh, Andrew and Chris Ryan. "Estimating Returns to Education: Three Natural Experiment Techniques Compared". Discussion Paper, No. 493. Centre for Economic Policy Research, ANU, August 2005.
4. Department of Education and Training in Western Australia. "Annual Report 2006-07". 19 October 2007
5. Commonwealth of Australia. "Intergenerational Report 2002-03, Budget Paper No. 5", 2002.
6. The first wave comprised reforms at the Commonxwealth level (floating of the $A, budget and tariff reforms). The second wave largely involved reforms of state owned industries (made easier by Commonwealth compensation payments).
7. Council of Australian Governments, "Communique", 10 February 2006.
8. SCRGSP (Steering Committee for the Review of Government Service Provision), "Report on Government Services 2008", Productivity Commission, Canberra. 2008, Table 4A.9.
9. Department of Education and Training in Western Australia. "Annual Report 2006-07". 19 October 2007, p1
10. Including an allowance for the user cost of capital.
11. These students are defined as those receiving disability funding by the Australian Government.
12. State comparisons are provided at SCRGSP (Steering Committee for the Review of Government Service Provision), "Report on Government Services 2008", Productivity Commission, Canberra. 2008, Table 4A.21. To be an eligible student with disabilities, the student (among other things) must satisfy the criteria for enrolment in special education services or special education programs provided by the government of the state or territory in which the student resides. (My emphasis.)
13. That is, there are greater difficulties in achieving "economies of scale".
14. Only the "very remote" share is shown in Figure 2. Some of these students will be included in the indigenous population.
15. Ryan, Matthew. "Public Funding of Australian Schools: The Facts", Research Paper for Association of Independent Schools of Victoria, July 2007, pp20-21. The estimate was for 2004-05. It is an average.
16. Ryan, Matthew. "Public Funding of Australian Schools: The Facts", Research Paper for Association of Independent Schools of Victoria, July 2007, pp20-21. Estimates were for 2004-05.
17. School staff is broadly defined and includes teaching and non-teaching staff but not cleaners and emergency and casual relief staff.
18. SCRGSP (Steering Committee for the Review of Government Service Provision), "Report on Government Services 2007", Productivity Commission, Canberra. 2007, p 3.34
19. SCRGSP (Steering Committee for the Review of Government Service Provision), "Report on Government Services 2007", Productivity Commission, Canberra. 2007, Table 3A.7
20. The definition of staff in Figure 5 includes the full time equivalent number of those staff mostly involved in duties at schools, excluding cleaners and emergency and casual relief staff.
21. Further details are provided in Box 3.16, SCRGSP (Steering Committee for the Review of Government Service Provision), "Report on Government Services 2006", Productivity Commission, Canberra. 2006
22. Comparisons across jurisdictions are made difficult because the criteria for obtaining a Year 12 certificates vary across jurisdictions. Broad trends are more important than precise numbers.
23. SES is based on the ABS Index of Disadvantage. Low socioeconomic status is the average of the three lowest deciles, medium socioeconomic status is the average of the four medium deciles and high socioeconomic status is the average of the three highest deciles. The comment is conditioned by the fact that it may be the result of low data quality -- see SCRGSP (Steering Committee for the Review of Government Service Provision), "Report on Government Services 2006", Productivity Commission, Canberra. 2006, p3.65. Indigenous students were not included in these calculations but are reflected to some extent in the low SES and very remote figures.
24. I am assuming the apparent unravelling is not the result of some aspect of the completion rate estimation methodology.
25. Department of Education and Training, "Annual Report 2006-07", pp25-28
26. SCRGSP (Steering Committee for the Review of Government Service Provision), "Report on Government Services 2007", Productivity Commission, Canberra. 2007, Table 3A.74
27. There are other international data such as Trends in International Mathematics and Science Study (TIMMS). However, PISA is arguably unmatched for its breadth of international coverage.
28. Thomson, Sue, Lisa De Bortoli. "Exploring Scientific Literacy, How Australia Measures Up" Australian Council for Education Research (ACER) 2008, p2.
29. 95 per cent
30. The statistical properties of the broader Australian sample (compared to the smaller WA sample) make it more useful for the purposes of this discussion.
31. The slope between SES and student scores in Figure 11 might suggest a stronger relationship. In fact, the figure shows the average score for each student in each SES group -- there is a large spread in those scores, which explains why the slope can be strikingly positive but the relationship strikingly weak. In 2006, SES explained 11 to 12 per cent of Australian student scores in science, reading and maths. Thomson, Sue, Lisa De Bortoli. "Exploring Scientific Literacy, How Australia Measures Up" Australian Council for Education Research (ACER) 2008, p228.
32. Thomson, Sue, Lisa De Bortoli. "Exploring Scientific Literacy, How Australia Measures Up" Australian Council for Education Research (ACER) 2008, p223
33. Council for the Australian Federation. "Federalist Paper 2, The Future of Schooling in Australia". September 2007. p12 and p17.
34. The advice is often attributed to Bill Gates but in fact the source is the book "Dumbing Down our Kids: Why American Children Feel Good About Themselves But Can't Read or Write" by Charles J. Sykes, St Martins Press. 1996.
35. Thomson, Sue, Lisa De Bortoli. "Exploring Scientific Literacy, How Australia Measures Up" Australian Council for Education Research (ACER) 2008, p71
36. For the science scale only.
37. The cost of schooling figures were supplied by the OECD for each nation (except Canada). I calculated a cost measure for WA schooling comparable with the other OECD countries by applying the cost relativity suggested by the Report on Government Services data to the OECD's Australian estimate.
38. On average, attendance at a government-provided school attracts a larger implicit public subsidy than attendance at a non-government school. See Ryan, Matthew. "Public Funding of Australian Schools: The Facts", Research Paper for Association of Independent Schools of Victoria, July 2007.
39. The arguments are summarised in Leigh, Andrew. "Schools Need a Report Card Too", Australian Financial Review, 20 December 2007.
40. Government of Western Australia, Department of Education and Training. "School Accountability Framework". 1 July 2005. In addition, there is some competition (and cooperation) in WA between clusters of schools aimed at, amongst other things, maximising use of infrastructure. Government of Western Australia, Department of Education and Training. "Local Area Education Planning". 1 July 2005
41. A school is declared "local intake only". Government of Western Australia, Department of Education and Training. "Enrolment". 1 May 2003.
42. The Ministerial Council on Education, Employment, Training and Youth Affairs (MCEETYA) -- comprising Australian, State and Territory, and New Zealand education ministers -- is the principal forum for developing national priorities and strategies for schooling.
43. It was Oskar Lange who made the theoretical case for how socialist resource allocation could replace a market -- which is fine if you don't expect to make any progress; that is, the economy is static. Lange, Oskar and Fred M. Taylor. On the Economic Theory of Socialism, University of Minnesota Press. 1938
44. The report was commissioned by the WA Minister for Education and Training in March 2006 and completed in March 2007. Department of Education and Training in Western Australia. "Literacy and Numeracy Review: Final Report". March 2007.
45. Technically, what is being measured is variation in student performance relative to variations in these six factors. The interactive effects are quite minor. The estimates are approximate and draw on a meta-analysis of over 500,000 studies.
46. This discussion is developed from Hattie, John. "What Makes Teachers Make a Difference. What is the Research Evidence?" Australian Council of Education Research (ACER) October 2003.
47. Leigh Andrew. "How Can We Improve Teacher Quality?", Melbourne Review, No. 3 November 2007.
48. In the December 2007 EBA offer, four year trained new graduate teachers would see their starting increment raised to a level 1.6 and they would be entitled to a $1600 starting allowance. See http://www.det.wa.edu.au/teachingwa/ccm/navigation/updated-eba-offer-dec-07/ and Department of Education and Training in Western Australia. "The School Education Act Employees' (Teachers and Administrators) General Agreement 2006".
49. Department of Education and Training in Western Australia. "The School Education Act Employees' (Teachers and Administrators General Agreement 2006".
50. McKinsey and Company. "How the world's best-performing school systems come out on top". September 2007.
51. Professional Learning Institute website, http://www.det.wa.edu.au/pli/ccm/navigation/about-the-professional-learning-institute/
52. Justine Ferrari, The Australian, 18 January 2008
53. A survey is provided in Leigh, Andrew and Sara Mead. "Lifting Teacher Performance", Progressive Policy Institute, April 2005.
54. Justine Ferrari, The Australian, 17 January 2008
55. The tax-free aspect violates good taxation principles.
56. The West Australian. "Treasury wants Qld, WA migration boost" January 19, 2008
57. See Leigh Andrew. "How Can We Improve Teacher Quality?", Melbourne Review, No. 3 November 2007, p4.
58. Recall Figure 7.
59. The minimum school leaving age amounts to government interference in the rights of young people to make their own life choices. The longer-run economic benefits of more schooling are clear cut in my view. In weighing up the loss of autonomy for young people against the broader economic options that more schooling provides, I give more weight to the latter. I accept that others may hold a different view.
No comments:
Post a Comment