A POSITIVE REFORM GUIDE TO THE 2008 ELECTION
1) State taxes should be reduced to encourage growth.
2) Western Australia's urban planning policies need to be reformed around the importance of home ownership. This involves releasing land for housing, sale and construction, and also relieving restraints on infill land use.
3) Western Australia needs to retain students longer. The key to doing so is to increase the levels of competition between schools, levels of competition between teachers, increase accountability and ensure that teacher salaries are nationally attractive.
4) Western Australia's rail network should be privatised in 2009. A tender would specify the level of subsidy, and the performance benchmarks necessary to meet that subsidy.
5) WA needs a dedicated reform movement to par back some of these outdated and onerous regulations. It also should set up formal agencies dedicated to regulatory review, and mandate that each new regulation is subject to a regulatory impact statement before implementation.
6) The Western Australian government should restrain the regulatory appropriation of land under the Western Australian Environmental Protection Act, and compensate landowners for future appropriations.
7) Western Australia should set up a voluntary electronic patient record system, and provide online performance indicators, to empower patients and increase the value of the Western Australian health system for Western Australians.
8) The Western Australian government needs to implement a broad range of initiatives to reduce unnecessary spending.
9) With the wealth created by the resources boom, Perth could easily be a cultural capital of Australia. But doing so requires a widespread deregulatory reform movement, focused on making the city appealing to both cultural producers and to cultural consumers.
10) Western Australian electricity generation, distribution and transmission should be privatised. Regulation affecting gas networks needs to be liberalised to facilitate further network expansion.
TEN PROBLEMS, TEN NEEDED REFORMS
WESTERN AUSTRALIA HAS SOME OF THE HIGHEST TAXES IN THE NATION
Western Australia now has some of the highest per capita taxes in the nation. Part of this is a consequence of WA's rapidly growing wealth, but it is also a consequence of a lack of enthusiasm for tax reform. That Western Australia is a wealthy state does not excuse or necessitate high tax burdens -- times of economic success are the times when states are best able to reduce their tax burden with minimal disruption. Reducing taxes would also add to the economic prosperity of the state, and further help it weather any future international downturn. Western Australia cannot hope to be both the wealthiest state in the country and the highest taxed for too long.
State taxes should be reduced to encourage growth.
HOUSING IS TOO EXPENSIVE
Western Australia, like many other housing markets across the country, is suffering from artificially inflated house prices caused by government planning processes. Urban house prices are skyrocketing as a direct consequence of thirty years of planning orthodoxy that prioritised density over affordability. That the cost of housing is artificially high can be demonstrated by comparing Perth with an analogous city that is not restrained by restrictive land release policies, in this case Houston.
And as house prices are going up, home ownership is going down, with younger and poorer families bearing the brunt of this effect.
Western Australia's urban planning policies need to be reformed around the importance of home ownership. This involves releasing land for housing, sale and construction, and also relieving restraints on infill land use.
SECONDARY EDUCATION NEEDS TO BE ATTRACTIVE RELATIVE TO EMPLOYMENT
Western Australia enjoys high quality education relative to other Australian states and relative to the rest of the world. Its spending on public education is the highest of the states, but it gets good value for money for its education system -- Western Australian students are among the top performers internationally in science, reading and maths.
However, Western Australia faces two challenges unique to the state. It has a high proportion of indigenous and remote students which present particular pedagogical and resource challenges. Furthermore, it has a lower than average year 12 completion rate, a rate which has begun to slip backwards in recent years.
A major reason for this lower completion rate is the attractiveness of work in WA. However, failing to complete year twelve places students at a disadvantage for future employment, particularly if the boom slows.
Western Australia needs to retain students longer. The key to doing so is to increase the levels of competition between schools, levels of competition between teachers, increase accountability and ensure that teacher salaries are nationally attractive.
PUBLIC TRANSPORT UNDERPERFORMS COMPARED TO ITS POTENTIAL
Perth's metropolitan rail network -- and the many users of public transport who rely on it each day -- would benefit enormously from the introduction of a user-centric transport network that would be brought about through privatisation. Public transport privatisation has many precedents within and without the state. The Transperth bus network and the Swan River ferry service are now privately operated, and much of the facilities management and cleaning of the rail network has been effectively privatised through contracting arrangements.
Analogous privatisations in other states have shown how privatisation can increase flexibility and punctuality, convenience, and most importantly, patronage. And crucially, any privatisation process can rely on the experience of others across the country.
Western Australia's rail network should be privatised in 2009. A tender would specify the level of subsidy, and the performance benchmarks necessary to meet that subsidy.
STATE REGULATION IS GROWING AND IS POORLY DESIGNED
Western Australia's regulatory burden is increasing. The increase in regulation and legislation over the last few decades is diverting resources away from productive work, restricting entrepreneurial activity, and ultimately depressing the Western Australian economy. In many cases, Western Australia has been a pioneer at forging new areas for regulation, while in other cases the state has failed to deregulate areas which have been successfully liberalised across the country.
Furthermore, the administrative mechanisms by which regulations are made are among the worst in the country. Proposed regulations are subject to little internal or external scrutiny, and subject to less consultation with affected industries than in other states.
WA needs a dedicated reform movement to par back some of these outdated and onerous regulations. It also should set up formal agencies dedicated to regulatory review, and mandate that each new regulation is subject to a regulatory impact statement before implementation.
ENVIRONMENTAL PROTECTION LAWS ARE UNDERMINING WESTERN AUSTRALIAN AGRICULTURE
Over the last few decades, there have been fundamental changes in the way Western Australian property owners have been able to use their land. These changes have come about from the introduction of mostly well-meaning environmental legislation that effectively nationalises private property, removing it from productive use. By utilising provisions in the Western Australian Environmental Protection Act, the government is able to designate certain areas of farmland as of high conservation value area, preventing their use by the owner.
The government is under no obligation to compensate landowners for regulatory appropriation, which both depresses economic development, and encourages the over-classification of land as conservation area.
The Western Australian government should restrain the regulatory appropriation of land under the Western Australian Environmental Protection Act, and compensate landowners for future appropriations.
HEALTH PERFORMANCE INDICATORS NEED TO BE TRANSPARENT AND ACCESSIBLE
Western Australia is a leader in the use of private hospitals to service public patients. While Western Australia spends slightly more on health than the national average, the use of private provision has served to reduce the cost of hospital services, without sacrificing treatment efficacy.
However, one clear area for reform is in patient empowerment. While Western Australia provides a number of patient information services and performance indicators, without a dedicated online service, patients are unable to easily access this information, and therefore less able to assess the quality of hospital service. Furthermore, patients and providers suffer from patient records which are inconsistent and incomplete, largely inaccessible to the health care providers which require them.
Western Australia should introduce a voluntary electronic patient record system, and provide online performance indicators, to empower patients and increase the value of the health system for Western Australians.
SPENDING IS UNRESTRAINED
Government spending can have perverse consequences which are unintended by policy makers. Western Australia's nationally high spending in many areas, in particular recreation, can crowd out private provision of services and cost tax-payers more than their value. Furthermore, government spending has the effect of locking in high -- and increasing -- levels of taxation, slowing growth.
The WA government, as with all Australian governments, has allowed its spending to increase in line with increases in revenue. This has the perverse effect of seeing government expand at the same time as the economy is booming. This spending increase indicates that government is allowing increased revenue to delay making tough reform choices.
The Western Australian government needs to implement a broad range of initiatives to reduce unnecessary spending.
CULTURAL POLICY
The levels of economic growth experienced by Western Australia should bring significant cultural and social dividends. But a mix of regulations and laws which restrain cultural production are hampering WA's significant potential in this area. Restrictive land policy makes it hard for cultural producers to find and construct artistic venues. Restrictive liquor licenses make it hard for venues to subsidise artistic events. Restrictive trading policies -- particularly WA's regressive shop trading hours -- prevent urban areas from the vibrancy that is necessary to build a cultural capital. Limited taxi licenses make late-night travel unappealing, as at least 10 per cent of travelers fail to order taxis successfully.
With the wealth created by the resources boom, Perth could easily be a cultural capital of Australia. But doing so requires a widespread deregulatory reform movement, focused on making the city appealing to both cultural producers and to cultural consumers.
ENERGY IS UNRELIABLE AND OVER-REGULATED
Western Australia's electricity markedly underperforms compared to the eastern states. Electricity generation is notably less reliable. The minutes of electricity lost through transmission exceeds all the other states combined. Outages in local distribution are regularly the highest in the country.
Based on the experience of other states, privatisation, accompanied by splitting the state generator into two firms, provides an effective remedy for these sorts of issues. Privatisation gives energy firms the flexibility and incentive to perform better.
Furthermore, the expansion of gas pipelines is held back by regulatory control which takes pricing decisions away from entrepreneurial pipeline owners.
Western Australian electricity generation, distribution and transmission should be privatised. Regulation affecting gas networks needs to be liberalised to facilitate further network expansion.
INTRODUCTION: THE OUTLOOK FOR WESTERN AUSTRALIA
In 1993, we published Reform and Recovery: An Agenda for the New Western Australian Government, a landmark study that concluded that despite moderate economic success, the Western Australian government had failed to capitalise on its opportunity to undertake, broad-based economic reform that would lock in that prosperity.
The same could be said now in 2008. The government has been living off the economic prosperity caused by the mining boom without committing to the low tax rates and low regulatory burdens that are the prerequisite for independent long term growth. Without broad based reform, Western Australia is vulnerable to economic downturn. It is our view that Western Australia needs to reform in the good times, rather than wait to be compelled to do so either by slowing economic growth or federal interference.
This chapter provides an overview and outlook for the Western Australian economy, and outlines the key policy challenges that lay ahead for the next state government, regardless of which political party wins the next election. As this chapter points out, the Western Australian economic boom has been prolonged and deep. But with great success comes constraints. There are many troubling signs on the economic horizon. Labour productivity is declining, yet wage pressure is intensifying. Taxation and spending policies have failed to adjust to the boom. Regulation is increasing exponentially, and regulation making is well below best practice. Energy, which has rightly dominated much political discussion, is less reliable than in any other state, and increasingly so.
Western Australia faces unique policy challenges. This reform document provides practical, concrete measures for Western Australia to face those challenges and further capitalise on its economic success.
THE IMPACT OF THE BOOM
Since its proclamation as a self-governing colony in 1890, Western Australia has been renowned globally for its natural attractions, extensive mineral wealth, technologically advanced industries and highly skilled workforce. It is with these comparative advantages that the state has forged a reputation for economic success.
And over the past ten years, Western Australia has become an "engine room" of the Australian economy. This development has been attributable to a host of favourable international and domestic economic conditions.
INTERNATIONAL CONDITIONS
Since the Asian financial crisis of the late 1990s, global economic growth has rebounded to average 3 per cent over the course of this decade (Table 1). (1) This trend appears to be broadly based across the advanced economies.
Table 1: International economic growth (GDP, annual percentage change, constant prices)
| 1997 | 1998 | 1999 | 2000 | 2001 | 2002 | 2003 | 2004 | 2005 | 2006 | 2007 | 2008 (est.) | |
| Global aggregates | ||||||||||||
| World | 3.5 | 2.1 | 3.1 | 4.1 | 1.5 | 1.9 | 2.6 | 4.0 | 3.4 | 3.9 | 3.7 | 2.6 |
| Advanced economies | ||||||||||||
| United States* | 4.5 | 4.2 | 4.5 | 3.7 | 0.8 | 1.6 | 2.5 | 3.6 | 3.1 | 2.9 | 2.2 | 0.5 |
| United Kingdom* | 3.1 | 3.4 | 3.0 | 3.8 | 2.4 | 2.1 | 2.8 | 3.3 | 1.8 | 2.9 | 3.1 | 1.6 |
| Euro area (15 countries) | 2.6 | 2.8 | 3.0 | 3.8 | 1.9 | 0.9 | 0.8 | 2.1 | 1.6 | 2.8 | 2.6 | 1.4 |
| Japan* | 1.6 | -2.0 | -0.1 | 2.9 | 0.2 | 0.3 | 1.4 | 2.7 | 1.9 | 2.4 | 2.1 | 1.4 |
| Newly industrialised economies | ||||||||||||
| Korea (Republic of)* | 4.7 | -6.9 | 9.5 | 8.5 | 3.8 | 7.0 | 3.1 | 4.7 | 4.2 | 5.1 | 5.0 | 4.2 |
| Singapore* | 8.3 | -1.4 | 7.2 | 10.1 | -2.4 | 4.2 | 3.5 | 9.0 | 7.3 | 8.2 | 7.7 | 4.0 |
| Taiwan | 6.6 | 4.5 | 5.7 | 5.8 | -2.2 | 4.6 | 3.5 | 6.2 | 4.2 | 4.9 | 5.7 | 3.4 |
| Emerging market & developing economies | ||||||||||||
| China* | 9.3 | 7.8 | 7.6 | 8.4 | 8.3 | 9.1 | 10.0 | 10.1 | 10.4 | 11.0 | 11.4 | 9.3 |
| India* | 4.7 | 6.0 | 7.1 | 5.5 | 3.9 | 4.6 | 6.9 | 7.9 | 9.1 | 9.7 | 9.2 | 7.9 |
| Indonesia* | 4.7 | -13.1 | 0.8 | 5.4 | 3.6 | 4.5 | 4.8 | 5.0 | 5.7 | 5.5 | 6.3 | 6.1 |
| Malaysia | 7.3 | -7.4 | 6.1 | 8.7 | 0.5 | 5.4 | 5.8 | 6.8 | 5.0 | 5.9 | 6.3 | 5.0 |
| Thailand* | -1.4 | -10.5 | 4.4 | 4.8 | 2.2 | 5.3 | 7.1 | 6.3 | 4.5 | 5.1 | 4.8 | 5.3 |
| United Arab Emirates* | 7.9 | 0.1 | 3.1 | 12.4 | 1.7 | 2.6 | 11.9 | 9.7 | 8.2 | 9.4 | 7.4 | 6.3 |
Note: Countries labelled with an asterisk are major trading partners of Western Australia.
Source: IMF World Economic Outlook Database, April 2008.
There has also been exceptionally strong growth recorded in the emerging markets of China and India. The performance of these "Asian tigers", and the recovery of Organisation for Economic Co-operation and Development economies, has created an unprecedented surge in demand for, and the prices of, mineral commodities (Figure 1).
Figure 1: Global commodity metals price index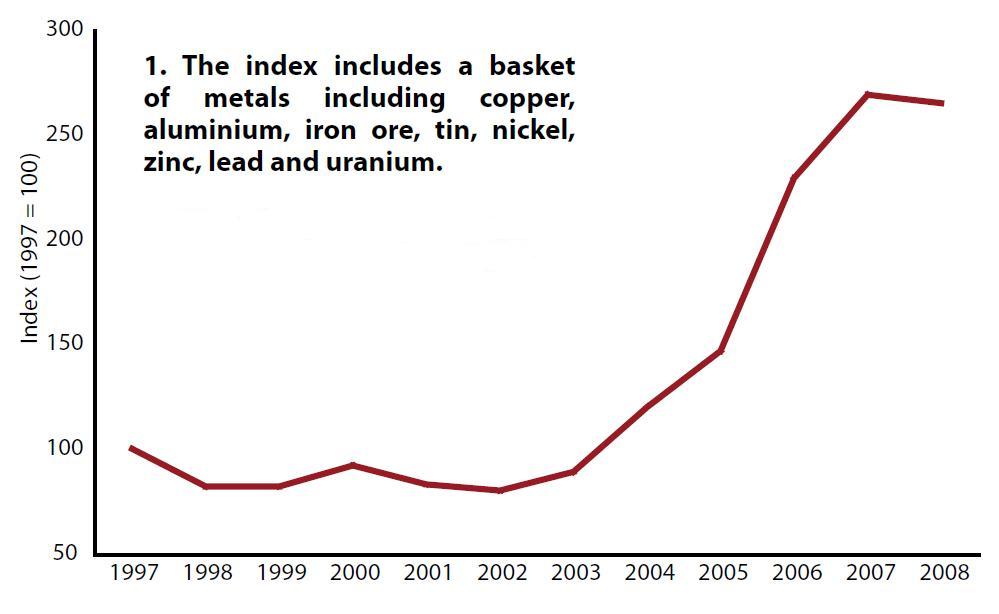 Source: IMF World Economic Outlook Database, April 2008.
This resources boom has been pivotal in explaining the robustness of Western Australia's external sector in recent years. Not only has the state's terms of trade improved, (2) but there has also been an upswing in merchandise exports -- from $1.7 billion in mid‑1997 to $6.4 billion in mid‑2008.
DOMESTIC CONDITIONS
The economic benefits of global economic growth and the resources boom have extended beyond the traded sectors, to positively influence almost every aspect of the Western Australian economy.
ECONOMIC GROWTH AND INCOMES
According to Australian Bureau of Statistics State Accounts data, Western Australia has averaged an economic growth rate of 4.3 per cent over the decade to 2006‑07. By comparison, the Australian economy has grown by about 3.6 per cent over the period. This has been particularly obvious since 2003, when growth in Western Australia accelerated above that of Australia as a whole. (Figure 2)
Figure 2: Annual output growth, 1996-2007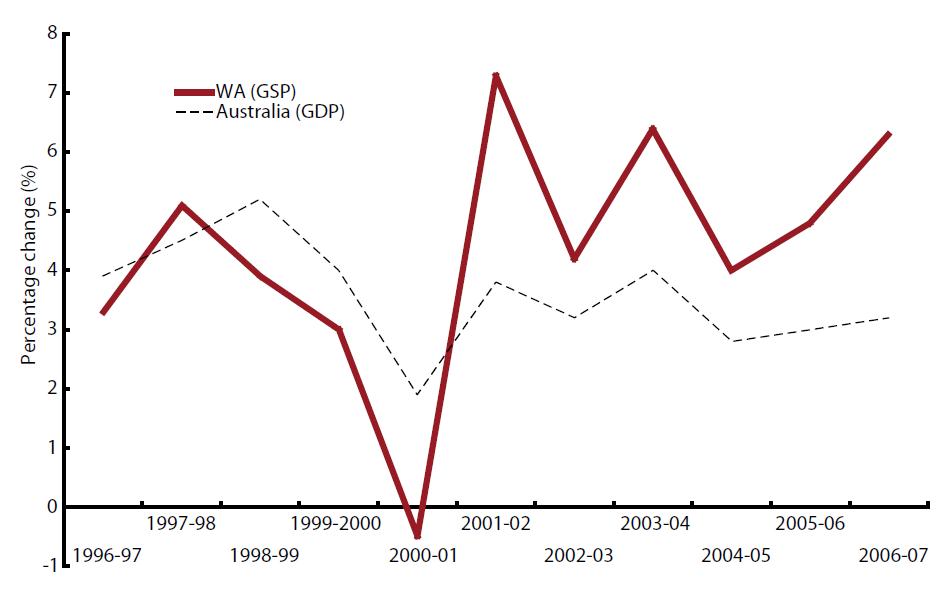 Source: ABS, Australian National Accounts: State Accounts, Cat. no. 5220.0.
As a consequence, after accounting for population, Western Australia had the highest gross state product per capita of all the states and territories in 2006‑07 (Figure 3). Western Australia's output per head of population exceeded that of NSW and Victoria by about 30 per cent, which is illustrative of a "two‑speed economy" effect across Australia.
Figure 3: Gross state product per capita, states and territories (chain volume measures, 2006‑07, $)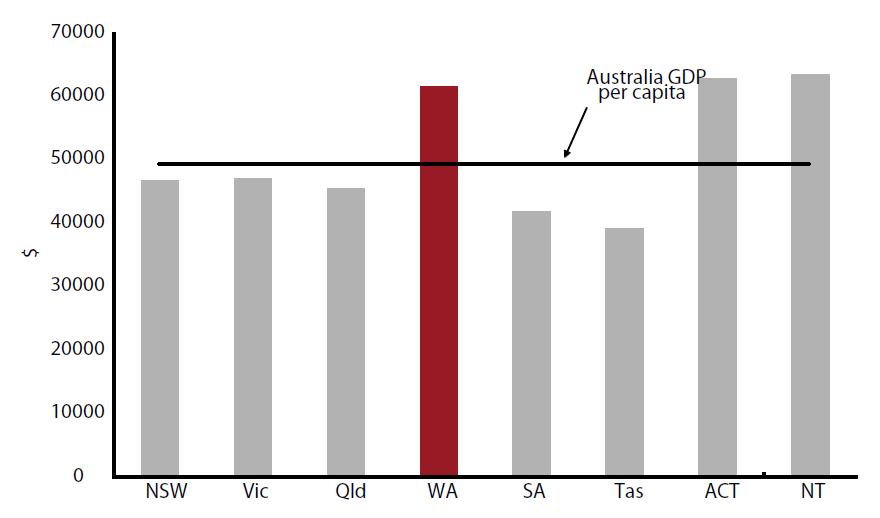 Source: ABS, Australian National Accounts: State Accounts, Cat. no. 5220.0.
Growth was recorded across all expenditure components of GSP (Table 2). The main drivers of growth were business investment (up $18 billion or 158 per cent) and household consumption (up $19 billion or 53 per cent), while dwelling investment also made a significant contribution.
Table 2: Western Australia GSP, expenditure components ($ million)
| 1996-97 | 2006-07 | Increase ($m) | Increase (%) | |
| Household consumption | 36,027 | 55,121 | 19,094 | 53.0 |
| Business investment | 11,487 | 29,674 | 18,187 | 158.3 |
| Dwelling investment | 7,080 | 10,817 | 3,737 | 52.8 |
| Government spending | 14,328 | 20,578 | 6,250 | 43.6 |
| Net exports | 26,853 | 32,949 | 6,096 | 22.7 |
| Balancing item | -12,880 | -21,364 | -8,484 | 65.9 |
| Gross State Product | 82,905 | 127,775 | 44,870 | 54.1 |
| Gross State Product per capita | 46,565 | 61,490 | 14,925 | 32.1 |
Note: Business investment data for 1996‑97 excludes purchase of second hand assets. Dwelling investment totals include ownership transfer costs. Balancing item implicitly comprises changes in inventories, total net interstate trade and balancing item discrepancy. Subtotals may not sum to total due to statistical discrepancies or rounding errors.
Source: ABS, Australian National Accounts: State Accounts, Cat. no. 5220.0.
EMPLOYMENT AND EARNINGS
Western Australia's strong macroeconomic performance has flowed through to the labour market (Table 3). Excluding the Australian Capital Territory and Northern Territory, Western Australia had the highest participation rate and lowest unemployment rate of all jurisdictions in 2007‑08.
Table 3: Selected labour market indicators (trend series)
| 1997‑98 | 2007‑08 | |||||
| Employment ('000) | Participation rate (%) | Unemployment rate (%) | Employment ('000) | Participation rate (%) | Unemployment rate (%) | |
| NSW | 2,834 | 61.5 | 7.4 | 3,398 | 63.5 | 4.6 |
| Vic | 2,136 | 63.2 | 8.2 | 2,627 | 65.0 | 4.5 |
| Qld | 1,586 | 64.9 | 8.7 | 2,159 | 67.1 | 3.7 |
| WA | 874 | 66.2 | 6.8 | 1,125 | 68.3 | 3.3 |
| SA | 650 | 60.7 | 9.6 | 772 | 62.8 | 4.8 |
| Tas | 195 | 59.0 | 10.5 | 231 | 60.9 | 4.9 |
| ACT | 154 | 71.3 | 7.3 | 190 | 72.5 | 2.6 |
| NT | 90 | 70.3 | 4.9 | 109 | 72.9 | 4.4 |
| Australia | 8,519 | 63.1 | 8.0 | 10,611 | 65.2 | 4.2 |
Source: ABS Labour Force, Australia, Spreadsheets, Cat. no. 6202.0.55.001; Moore 2006.
While the growth in state wages has closely tracked the national trend for much of the past ten years, wage pressures have recently intensified. This is reflected in the growing gap between the state and national wage price indexes (Figure 4).
Figure 4: Wage price index (ordinary time hourly rates excluding bonuses, all sectors and occupations)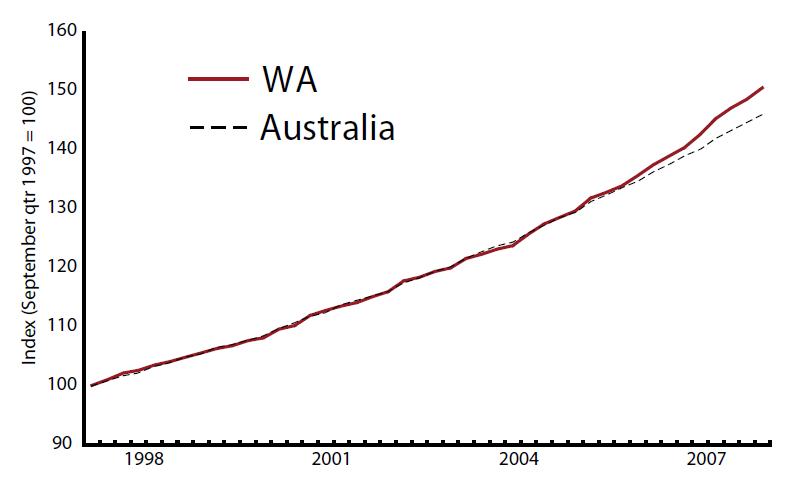 Source: ABS Labour Price Index, Australia, Cat. no. 6345.0.
PRODUCTIVITY
Productivity is a measure of the rate at which goods and services are produced per unit of input (such as labour or capital). Growth in productivity is an important indicator of the capacity of an economy to generate higher incomes and thus sustain improvements in living standards.
The available evidence suggests that Western Australia has recorded relatively strong productivity growth over the long term. It has been estimated that the average annual labour productivity growth rate for Western Australia was about 2 per cent (the equal highest of all states) from 1993‑94 to 2005‑06. (3) The state's multifactor productivity growth was estimated at 1.3 per cent for the same period (behind Queensland's growth of 1.6 per cent). (4)
A detailed analysis of a recent productivity cycle (1998‑99 to 2003‑04) found that Western Australia shared the highest average annual growth of labour productivity (with Queensland) of 2.8 per cent over the period. However, in 2004‑05, the state's labour productivity growth fell by 3 per cent compared to the previous year. (5) Western Australia's labour productivity growth was generally flat in recent years. (6)
WESTERN AUSTRALIA'S POSITION IS UNCERTAIN
IN A GLOOMY INTERNATIONAL ECONOMIC OUTLOOK
Given the overall strength of Western Australia's economic performance, it would be easy to conclude that the good times will carry on indefinitely. However, the current economic climate has brought with it challenges which could threaten the medium to long term outlook for the state economy.
There are more uncertainties in the global economic outlook than at any other time over the past few years. The global "credit crunch" is still unfolding and, although its direct effect on the Western Australian economy has been modest to date, higher interest rates and a lack of liquidity in credit markets may place downward pressures on state household consumption, business investment and the housing market. Business and consumer confidence in the economic outlook have also softened in recent months.
There is also the risk that a greater‑than‑expected downturn in the US, Europe and Japan could hinder growth for WA's major trading partners in the emerging markets of Asia. This could, in turn, lead to a reduction in demand and prices for commodity exports -- and, hence, curtail the resources boom that has underpinned the state's economic prosperity.
A more pressing concern appears to be increasing wage and input costs due to tight labour market conditions and capacity constraints. According to the state's Chamber of Commerce and Industry:
"the most critical challenge that is facing Western Australia is the emergence of critical and widespread labour shortages. Since the current phase of economic expansion started six years ago, almost 200,000 jobs have been created in the WA economy. However, these additional people employed throughout the WA economy have not been sufficient to meet demand, with labour shortages becoming a key limiting factor to additional growth in this state". (7)
Indeed, growth in wage and other costs are nearing record levels, signalling a build‑up in inflationary pressures for the broader state economy. Apart from their effect on costs, the continuation of capacity constraints could also lead to the delay or deferral of major investment projects.
One of the more serious threats to the state's economic outlook, over the long run, is the prospect of stalled or declining productivity growth. To some extent, the flat growth rate of labour productivity in recent years could be explained by the absorption of additional workers (that require training) by Western Australian businesses, or business investment activities that have not yielded output to date.
However, state government fiscal and regulatory settings that impede economic development could dampen Western Australia's productivity outlook.
WESTERN AUSTRALIA HAS SOME OF THE
HIGHEST TAX BURDENS IN THE NATION
In 2006-07, the Western Australian government collected $5.7 billion in tax revenue. That is up an astonishing 98 per cent from the 2000-01 tax take. Further, the tax burden has increased dramatically over the past decade. According to Australian Bureau of Statistics data, the per capita tax burden has increased from $2,079 in 1998-99 to $3,229 in 2006-07. That figure, however, understates the increase in Western Australian state taxation because it does not take the GST reforms into account. In 2000-01, the per capita state taxation take was a mere $1,870. Since 2003-04 Western Australia has had an above average taxation tax take compared to the other states and territories, and after 2005-06, Western Australia has had the highest per capita level of state taxation within Australia. The most obvious explanation for this growth in taxation is the overall economic growth of WA. It is important to note, however, that the tax take has increased far more than the size of the Western Australia economy.
Figure 5 shows the growth in Western Australian taxation per capita compared to the growth in per capita taxation for the Commonwealth and also for New South Wales and Victoria. An index is created for each series with the values in 2000-01 = 100.
Figure 5: Relative Taxation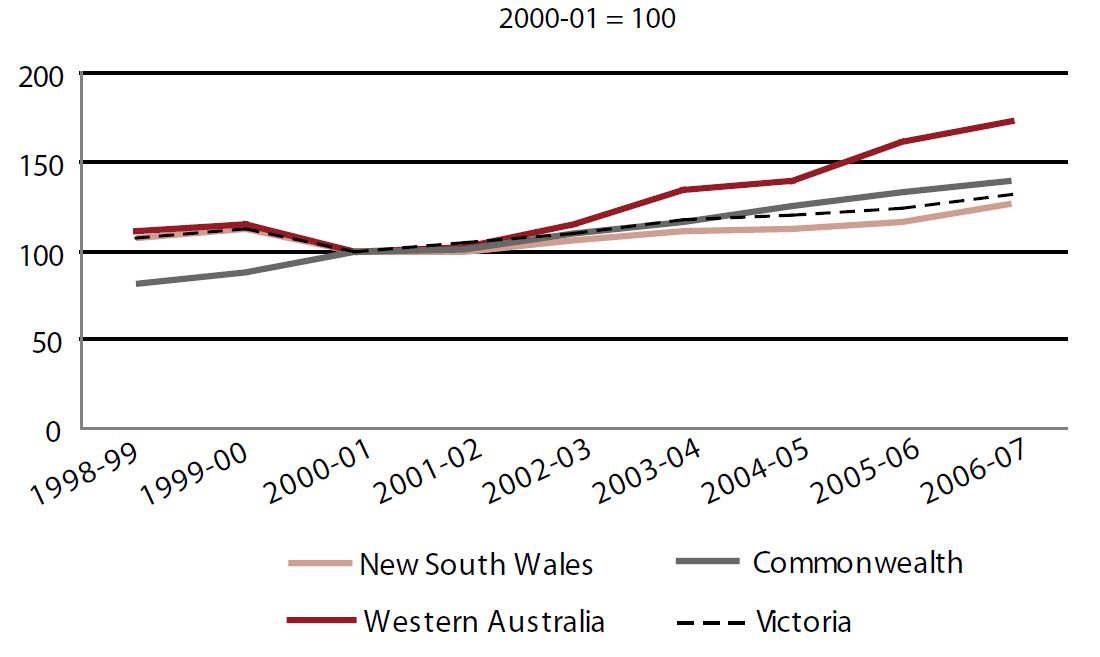
The growth in per capita Western Australia taxation has far exceeded that of New South Wales, Victoria and the Commonwealth.
The largest sources of increased tax revenue come from payroll tax (growth of 93 per cent since 2000-01) comprising 28 per cent of state revenue, and stamp duty (growth of 246 per cent since 2000-01) comprising 38 per cent of state revenue. Increases of this magnitude for those sorts of taxes are entirely consistent with WA's status as a high growth state. It is entirely unsurprising that taxation revenue in these categories has increased to the extent that it has. It is also the case that the Western Australian government has shown little initiative to either increase the tax rates, or to decrease the tax rates. In other words, the massive increase in tax revenue is simply due to improved economic conditions in WA. The government has been a passive recipient of all of this tax revenue.
BUSINESS TAXATION
Using our State Business Tax Calculator, it is possible to examine the business taxation environment of Western Australia and compare that to other states. (8)
The state business tax burden has fallen in Victoria, New South Wales and Western Australia from 2007 to 2008. The decline in Western Australia's business tax burden is about 4.5 per cent -- similar to that of Victoria. Given the economic growth that Western Australia has experienced, it is clear that more can be done in this regard.
Despite a record tax take, there has been no movement towards tax reform or initiatives to restrain spending.
GOVERNMENT SPENDING IS UNRESTRAINED
Figure 6 compares the expenditure choices of the Western Australia government to those made by other Australian state and territory governments. In many respects, those choices are very similar and given the constraints and incentives facing the various states and territories, we are not surprised to find similarities at the broader level. At the aggregate level, Western Australia does appear to spend a greater proportion of its budget on public order and safety, housing and community amenities, and also recreation and culture. At this level of analysis, Western Australia appears to spend less of its budget on general public services and social security and welfare.
Figure 6: State Expenditure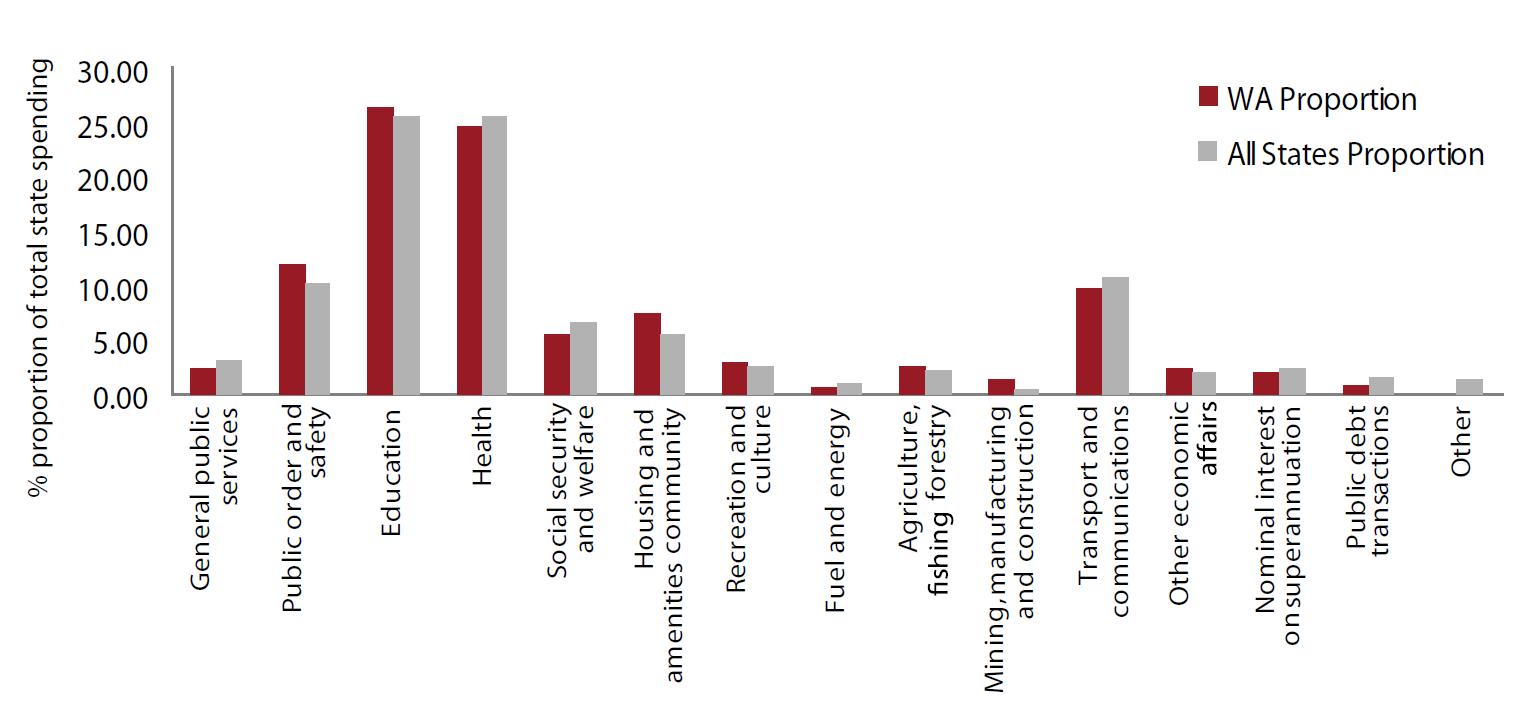 Source: ABS Statistics. Cat. 5512.0 (2006-07 data)
Within those broader categories there are additional choices that the government has made that can be highlighted. For example, the overall budget spend on education is broadly similar to the other states, yet the Western Australian government has increased spending on primary and secondary schooling while cutting expenditure on post-secondary schooling. Similarly with health, the government has spent a lot less on acute health institutions while spending much more on recreational facilities and services.
Similarly, we are able to investigate the growth in spending across various categories. Figure 7 shows the growth in spending between 2000-01 and 2006-07. The priorities of the Western Australian government in some areas have been very different to those of the other state and territory governments. For example, the growth in spending in public order and safety has been very large, while general public services spending has fallen dramatically.
Figure 7: Growth in Spending 2000-01 to 2006-07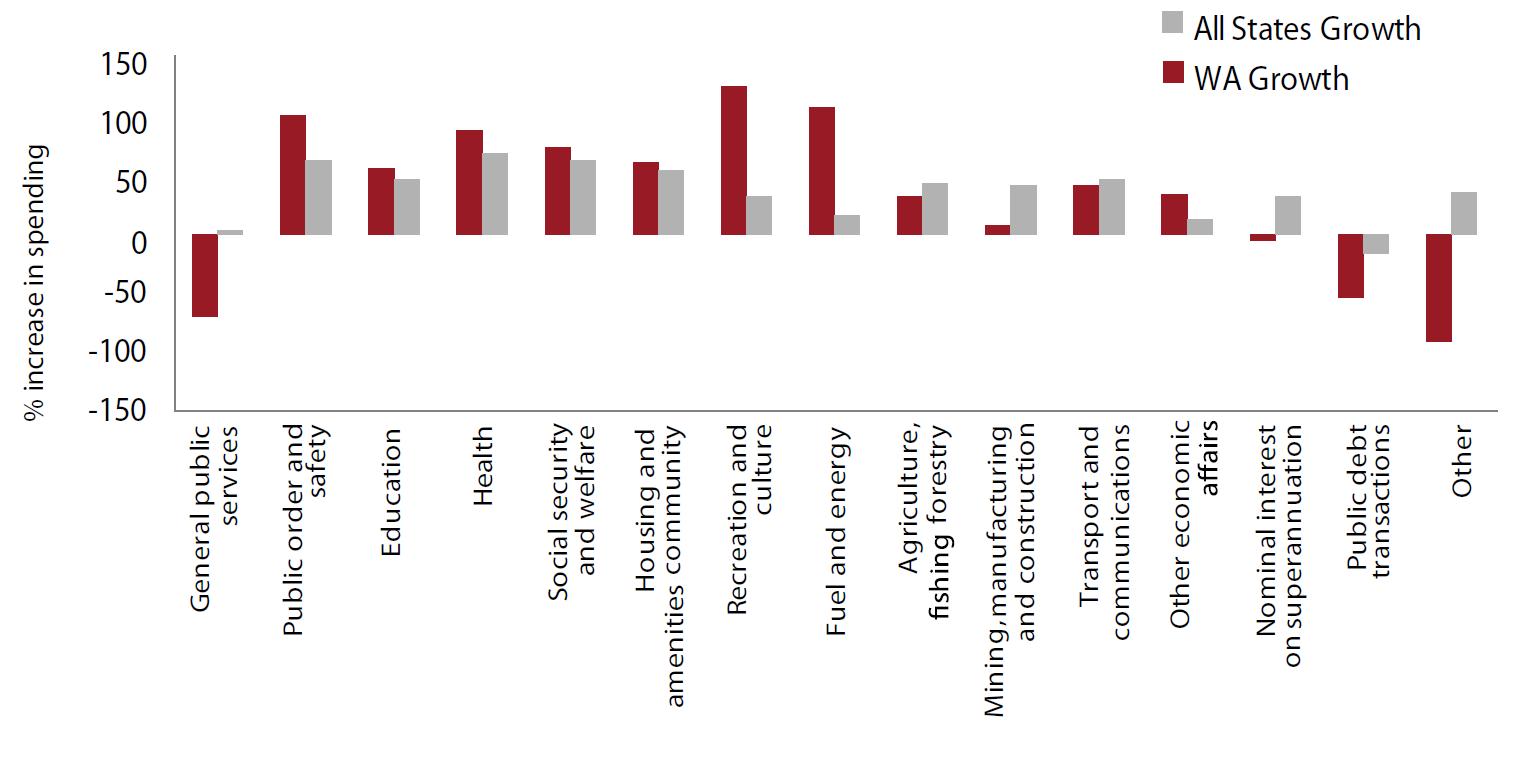 Source: ABS Statistics. Cat. 5512.0
WESTERN AUSTRALIA'S REGULATORY
BURDEN IS HEAVY AND INCREASING
The Western Australian government has been imposing a steady legislative and regulatory burden upon the Western Australian economy and society. Figure 8 shows the significant increase in pages of legislation passed -- a standard proxy for changes in the relative regulatory burden -- over the last half century. (9)
Figure 8: Pages of legislation passed per year, Western Australia, 1959-2006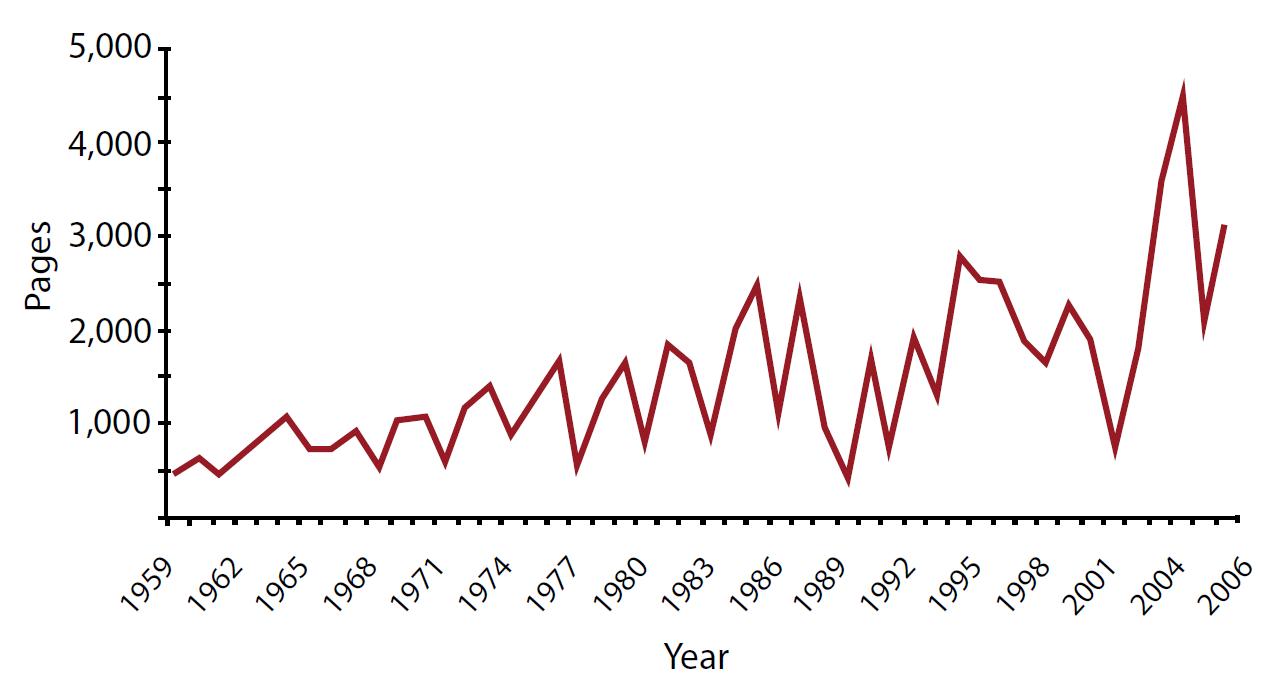
Comparing the regulatory burden between states is difficult. Nevertheless, evidence suggests that Western Australia is a particularly heavily regulated state. The Chamber of Commerce and Industry Western Australia surveyed its members and found that regulatory compliance impacted business particularly heavily. (10) These businesses nominated the pace of regulatory change as a distinct issue. Small businesses reported that they spent up to 18.5 hours each week complying with existing regulations, researching new and amended laws and changing internal systems and business processes to cope with regulatory changes. For medium sized businesses, that figure increased to 26.4 hours, and large firms spent on average 70.3 hours on regulatory issues each working week.
The CCIWA estimate that the average compliance costs for small businesses were $24,500, ranging up to $525,421 for large firms. They further estimates that this yielded a total cost of regulatory compliance of $2.1 billion across the state, or almost 2 per cent of GSP.
As these figures reveal, a large consequence of a high regulatory burden is the complexity it adds to business processes. This is particularly pronounced in the resources and agricultural sectors. The Western Australian Farmers Federation has shown that farmers in 2007 had to comply with 30 state Acts and 86 state regulations. (11) Compounding this are the many federal Acts and regulations, and local government rules which apply to their industry. Federal legislation and regulation is, if anything, increasing at a more significant pace than its Western Australian equivalent, and Western Australian businesses have to comply with all levels of government.
Of course, these sorts of analyses of regulatory impact necessarily focus on the compliance cost of regulation, which is a small portion of the total cost of regulation. As Productivity Commission Chairman Gary Banks has pointed out, "regulations not only create paperwork, they can distort decisions about inputs, stifle entrepreneurship and innovation, divert managers from their core business, prolong decision making and reduce flexibility." (12) It is the economic activities that regulations prevent, rather than the compliance costs of regulation, that constitute the biggest impact of over-regulation.
The design and implementation of regulation in Western Australia is also well-below national best practice. The Business Council of Australia has rated Western Australia's regulation making "poor" -- the only state in the country to receive that distinction -- largely to do with the state's lack of formal regulatory impact statement requirements, its relative lack of regulatory review processes, and the absence of an independent regulatory oversight agency. The BCA points out that this means that regulation making in Western Australia is far less transparent, and less consultative than other states. (13)
ENERGY
Western Australia has vast supplies of natural gas and limited supplies of coal. The gas is, in the main, poorly located for the domestic market while the coal is relatively poor quality compared to that in the eastern states.
But nevertheless, the vast majority of the problems facing the Western Australian energy sector have been created by government policy, not any natural circumstances.
Considerable intervention within energy policy has led to a situation where, compared with the eastern states, the supply is high cost, vulnerable to sudden shortages and generally subject to excessive outages. These matters have been exacerbated by the government's ambitious emission reduction policy.
ELECTRICITY SUPPLY
The integrated electricity industry has been split into separate generation, transmission distribution and retail businesses.
At the time of reforming the previously integrated Western Power, the government opted to retain the generation assets under a single structure (Verve Energy) though capping the amount of electricity capacity the business could own so as to allow room for new suppliers. The market itself is composed of bilateral contracts with any residual needs/surpluses being available on a spot basis. Though different in structure from the National Energy Market, the outcome is not markedly different since NEM operates largely on a de facto contract basis.
Western Australia's generation system (South West Interconnected System only) has long performed more poorly than that of the eastern states. In terms of the measure of their ability to be ready to supply (the "Availability Factor") the generation units lagged those of all other state systems in 2006/7, a pattern that is generally observed in earlier years.
Figure 9: Equivalent availability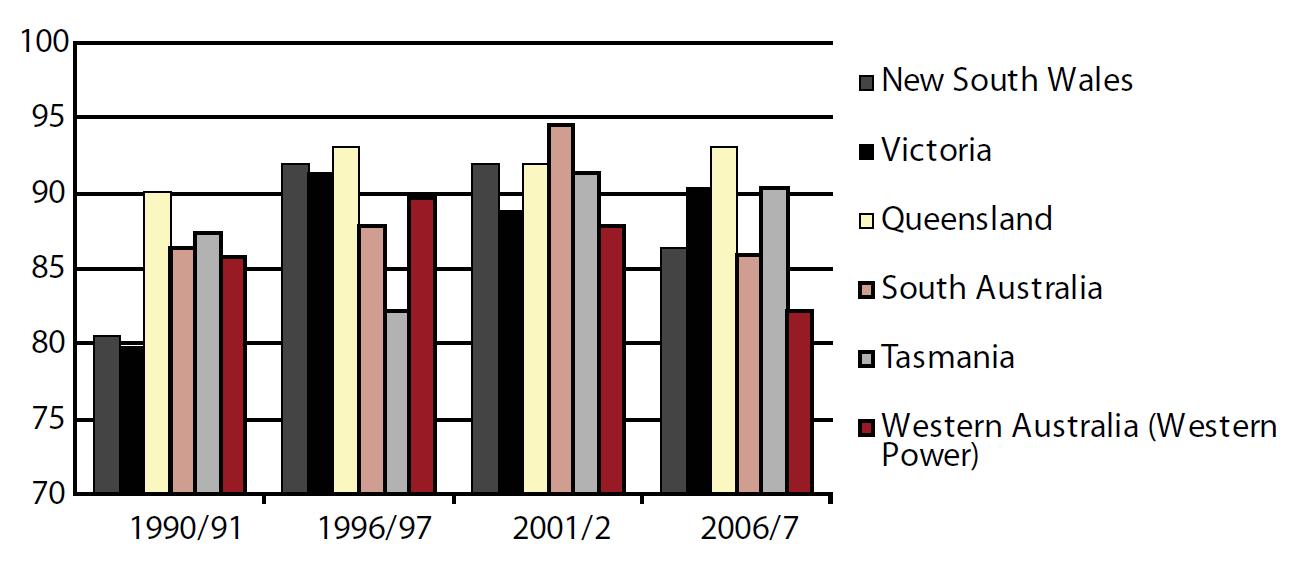
Verve has by far the largest market share with over 3000 MW of coal and gas capacity (as well as some wind). New capacity has become available through Babcock and Brown and Transfield owned facilities. Even so, competition is limited and it would have been preferable to break Verve into at least two businesses centred around the major facilities of Muja, Kwinana, Pinjar, Collie, Cockburn and Mungarra. Such a process could still be effected and would offer a better road forward than the very gradual attrition of Verve's monopoly supply that will otherwise take place.
Generation of electricity has no reason to be publically owned. Electricity generators are factories and operate like many other such facilities. Interstate and international experience has demonstrated considerable efficiencies resulting from it being moved into private ownership. Private ownership is better able to act in pursuit of profitable opportunities -- to seek alliances with other firms, synergies through diversifications, to sell off aspects of the business that are underperforming and to contract for labour and other inputs without any political oversight.
We would also expect that a privatised Verve -- especially one split into rivalrous businesses -- would find improved operating arrangements, rather like the elderly Hazelwood plant in Victoria has.
The relatively poor performance in generation is also seen in other areas of the supply system.
In transmission, the minutes lost in Western Australia in 2006-07 exceeded those of all other states combined. Outages in local distribution are also high by the standards of the rest of Australia. They were the second highest in 2006-07 and 2005-06 and the highest in 2004-05.
In this case too, privatisation should be the approach. The Victorian and South Australian privately owned networks have shown considerable improvement in service while operating profitably and avoiding "gold plating" the facilities.
Privatisation does not endanger the performance of any public policy roles, nor does it allow consumer exploitation since the natural monopoly components, as is the case now, would remain regulated.
GAS
Gas policy in Western Australia has been dominated by the Dampier to Bunbury Natural Gas Pipeline (DBNGP). Having been originally built in 1984 with the assistance of government, even when it was later sold it remained the subject of regulatory controversy. Among the difficult outcomes of this has been shortages in capacity especially in 2003 and 2004 due to disputes between the owners and the regulator as to the appropriate pricing of this.
While the issue of capacity pricing has abated somewhat, it remains a potent source of disputation. The ability of the pipeline to expand and its owners to receive an acceptable return from this has depended upon a coalition of users to agree on the terms of the expansion. There is no possibility of the owner acting entrepreneurially to expand capacity, since to do so would leave its pricing strategy in the hands of the regulator. Regulatory arrangements that allow commercial matters to be determined at greater arms length from the regulatory structure should be developed.
More recently, gas issues have been dominated by the Varanus explosion that has cut supply and caused more enduring shortages as a result of inabilities to contract on terms sought by retailers and other users. Gas in Western Australia has already confronted issues likely to be faced generally as a result of the price here being lower than the international price and the options owners have to sell gas overseas. These matters are likely to bring increased gas prices, and the regulatory approach of requiring gas to be sold domestically at a discount is one that will result in reduced benefits to Australia generally.
Gas reticulation, with the sale of Alinta and subsequent ownership changes, is in private hands and operates highly efficiently.
WESTERN AUSTRALIA'S FUTURE DEPENDS HEAVILY
ON THE GOVERNMENT'S POLICY DIRECTION
Despite the dominance of the Commonwealth government over national economic affairs, the states retain policy levers over "the formation of both physical and human capital, and therefore economic growth and productivity". (14) The key question going forward is what state policymakers choose to do with these levers, given the economic opportunities and challenges facing Western Australia.
In essence, there are two policy options open to the Western Australian government:
- It can continue on its current course -- by largely keeping its hands off the productivity policy levers -- and risk the economic and fiscal consequences of a terms of trade "crunch" when the resources boom fades; or
- It can act now and invoke forward‑looking reforms to boost the productive potential of the state economy and so ensure that it continues on a sustained growth path, irrespective of the future outlook for commodity markets.
It is against these choices that we have produced Project Western Australia. The Project illustrates that the pursuit of a unilateral "productivity‑plus" reform agenda by the Western Australian government could yield potentially significant benefits for all residents of the state.
Indeed, the 2008 election comes at a critical juncture in the state's economic history. By taking the "high road" of a comprehensive economic reform agenda, the next Western Australian government has a unique opportunity to propel the brash, vibrant jewel of the West towards a new plane of economic excellence.
ENDNOTES
1. Includes estimates for growth for 2008.
2. According to ANZ Economics, Western Australia's terms of trade has increased by about 35 per cent over the past five years. ANZ Bank Economics Group, 2008, "Western Australia: Boom continues, but some doing it tougher", ANZ States and Territories Economic Update, July.
3. From 1984‑85 to 2005‑06, Western Australia's average annual labour productivity growth rate was 2 per cent -- the highest for all jurisdictions. Over half of this growth was accounted for by capital deepening -- or an increase in the capital to labour ratio.
4. Multifactor productivity (or MFP) measures the changes in output per unit of combined inputs.
5. Des Moore, The Role of Government in Queensland, Report to Commerce Queensland, May 2006.
6. Gudrun Meyer-Boehm, "Economic Output and Productivity Performance of the Australian States", Productivity Commission, Productivity Perspectives Conference, December 2007.
7. Chamber of Commerce and Industry of Western Australia (CCIWA), 2007, 2008-09 Pre Budget Submission to the Western Australia Government, November.
8. Our State Business Tax Calculator determines the tax burden of a virtual company operating within various Australian states. As that company goes about its business, it will be liable for a range of state business taxes. We simulate that business behaviour and then calculate the tax burden the company would bear were it to operate in a specific Australian state or territory.
9. The validity of this measure is discussed in Richard J. Wood, The Growth of Australia's Regulatory State: Ideology, Accountability and the Mega-Regulators, 2008
10. Regulation and compliance: A Discussion Paper, Chamber of Commerce and Industry Western Australia, Business Leader Series, November 2006
11. Western Australian Farmers Federation, Submission to the Productivity Commission Annual Review of Regulatory Burdens On Business -- Primary Sector, June 2007.
12. Gary Banks, "The Good, the Bad and the Ugly: Economic Perspectives on Regulation in Australia" Address to the Conference of Economists, Business Symposium, Hyatt Hotel, Canberra, 2 October 2003.
13. Business Council of Australia, A Scorecard of Red Tape Reform, May 2007.
14. Crossman, Peter, 2000, "Drivers of Queensland's Economic Growth", Paper presented to Annual Conference of Economists, July.
CHAPTER 1
FIXING THE CRISIS: A FAIR DEAL FOR HOMEBUYERS IN WA
CHAPTER 2
MOVING IN THE RIGHT DIRECTION: TRANSPORT REFORM IN WESTERN AUSTRALIA
CHAPTER 3
CREATING A LIVEABLE CITY: HOW PERTH CAN CAPITALISE ON THE RESOURCES BOOM
CHAPTER 4
RESHAPING THE LANDSCAPE: THE QUIET EROSION OF PROPERTY RIGHTS IN WESTERN AUSTRALIA
CHAPTER 5
TOP OF THE CLASS: MAKING THE MOST OF WESTERN AUSTRALIA'S SCHOOL SYSTEM
CHAPTER 6
TAKING THE PULSE: REFORM INITIATIVES FOR THE WA HEALTH SYSTEM
No comments:
Post a Comment